

While you focus on hitting wRVU targets, commercial insurers are paying an average of 184% of Medicare rates for professional services, a figure that often remains hidden during contract renewals. It's frustrating to sit across from hospital administrators who rely on self-reported MGMA surveys that may not reflect the actual revenue your specialty generates in your specific market. You likely feel that your clinical contributions are being undervalued because of a fundamental lack of transparency in commercial reimbursement rates.
We're here to change that narrative. This guide demonstrates how to leverage authoritative RAND pricing data for physicians to transform opaque benchmarks into a rigorous, data-backed argument for a higher base salary. You'll learn how to quantify your true economic value by applying the latest commercial-to-Medicare multipliers to your specific practice profile. We'll examine the 2026 Medicare Physician Fee Schedule adjustments, including the new conversion factors, and provide a clear framework for using objective data to secure the fair contract you deserve.
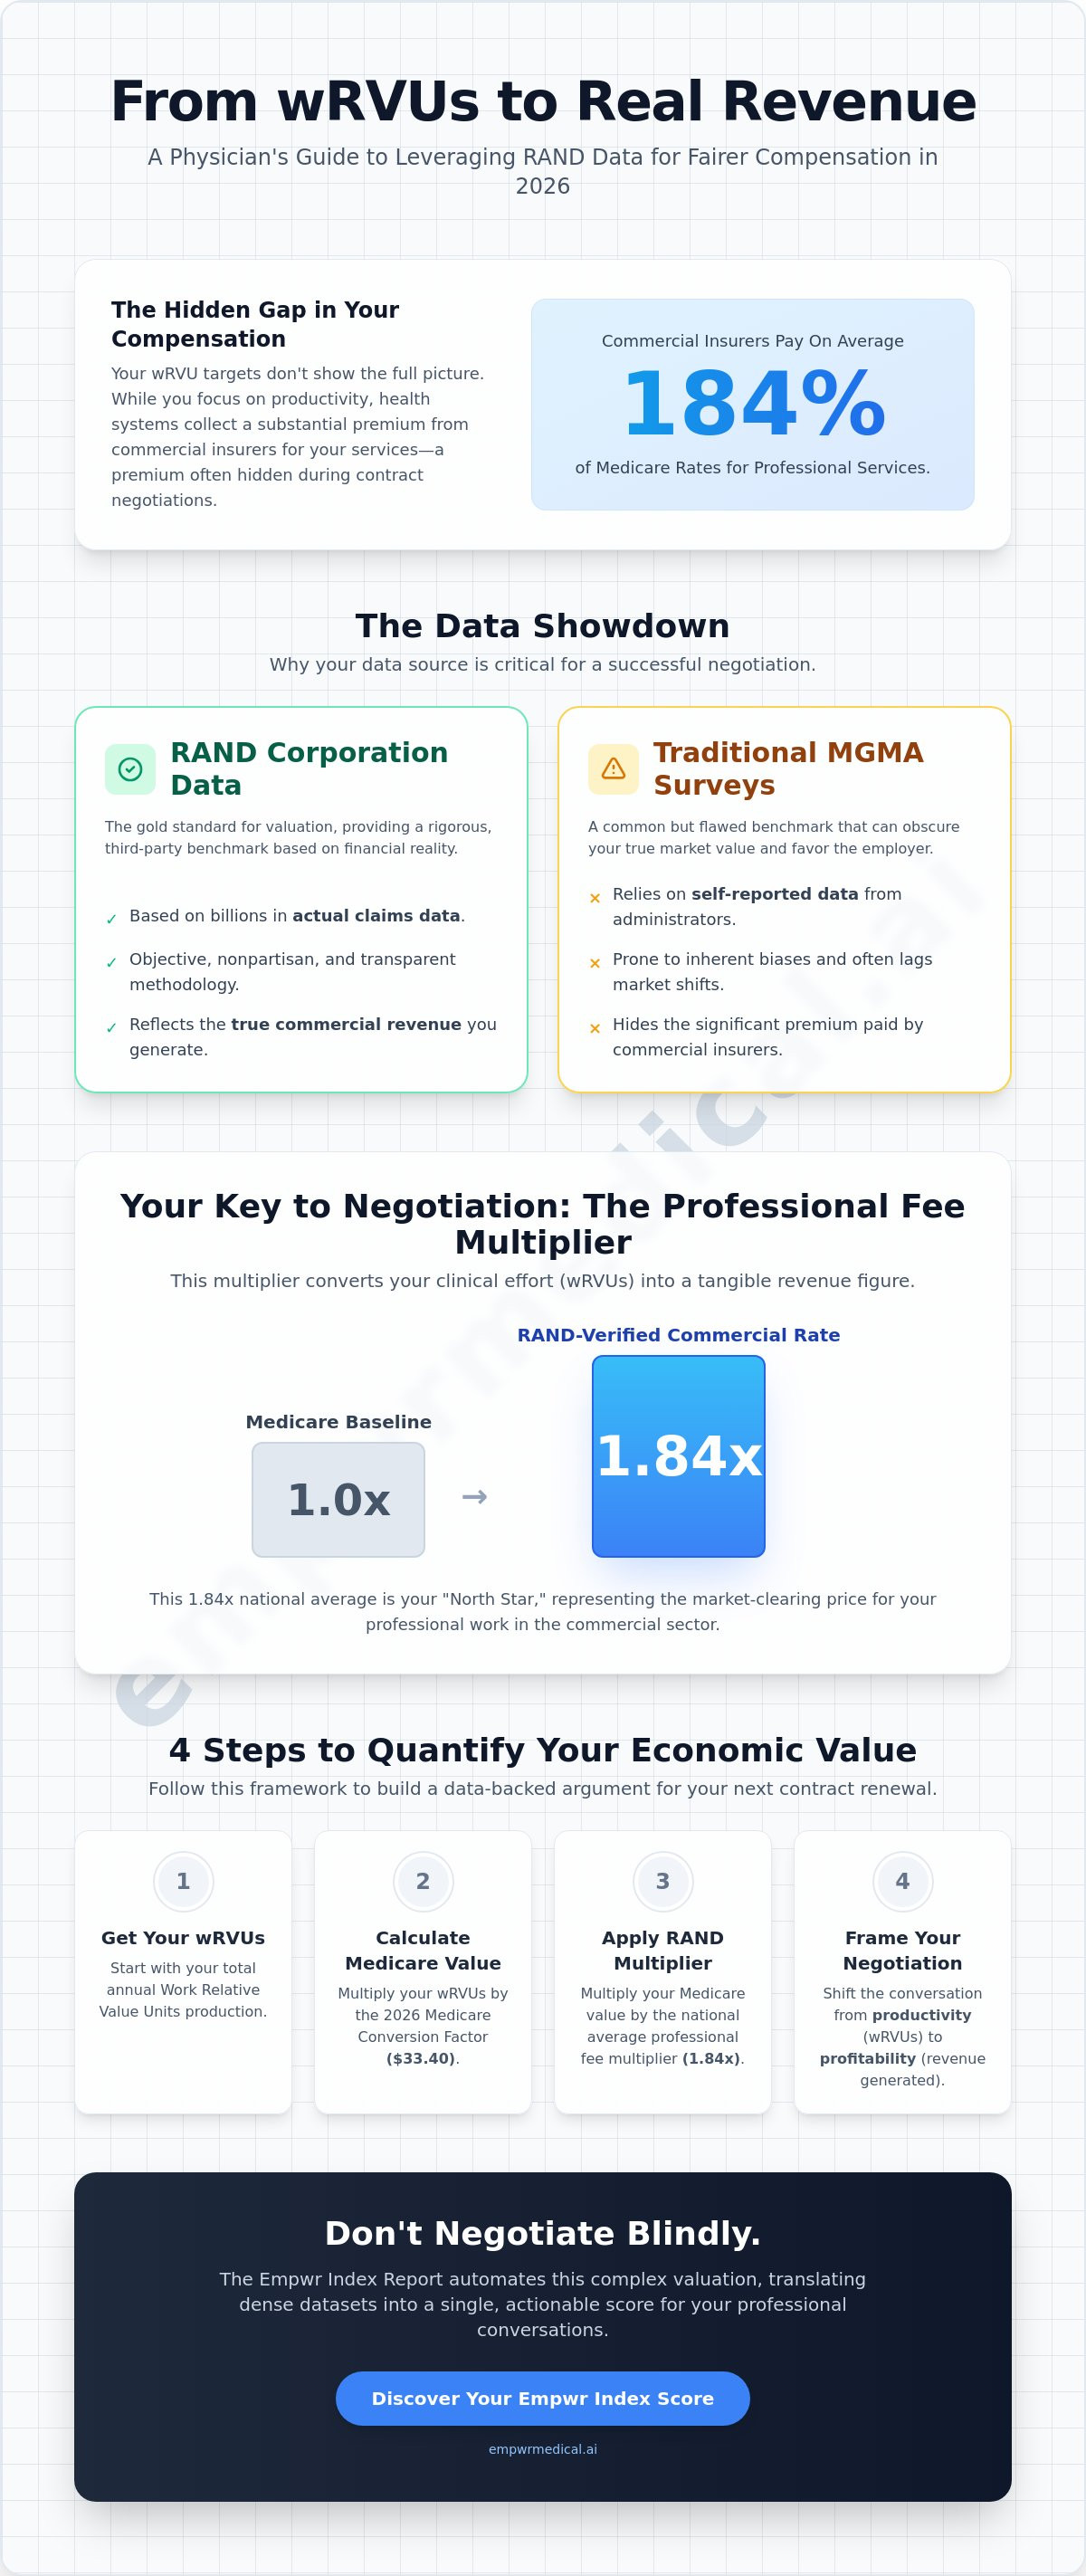
Key Takeaways
- Understand why actual claims data provides a more accurate reflection of your economic contribution than self-reported surveys like MGMA.
- Learn how to utilize RAND pricing data for physicians to identify the professional fee multiplier, which quantifies the premium commercial insurers pay over Medicare rates.
- Discover how to transition your negotiation strategy from simple wRVU targets to a sophisticated analysis of actual revenue generated for the health system.
- Identify the specific steps to calculate your individual economic value by combining production data with location-adjusted commercial benchmarks.
- Explore how the Empwr Index Report automates complex valuations by translating dense datasets into a single, actionable score for informed professional conversations.
What is RAND Pricing Data and Why Should Physicians Care?
The RAND Corporation, a nonpartisan research institution, launched its Hospital Price Transparency Study to provide an objective look at the wide variation in healthcare costs. For years, hospitals and insurers kept negotiated rates behind a veil of confidentiality, leaving practitioners with little leverage during contract renewals. This initiative changed the dynamic by analyzing billions of dollars in actual claims data to reveal the precise ratios between commercial insurance payments and Medicare rates. For the individual practitioner, RAND pricing data for physicians provides a rigorous, third-party benchmark to define their commercial "multiplier."
Unlike traditional compensation surveys that rely on self-reported salary figures from hospital administrators, RAND's methodology is rooted in financial reality. It looks at what was actually paid for specific CPT codes. This distinction is critical because self-reported data often lags behind market shifts or contains inherent biases that favor the employer. By using claims-based evidence, you can move away from abstract "fair market value" arguments and toward a precise calculation of your true contribution margin in 2026.
The Shift from wRVUs to Commercial Revenue Reality
Work Relative Value Units (wRVUs) are the standard metric for measuring clinical effort, but they only tell half the story of your economic value. A wRVU is a measure of volume and intensity, not a measure of the actual dollars flowing into a health system. RAND data exposes the significant gap between Medicare's baseline and what private payers actually remit. While your contract might be tied to a static dollar-per-wRVU rate, the hospital is likely collecting a substantial premium on your services. In 2026, as health systems face tightening margins, using RAND pricing data for physicians allows you to demonstrate exactly how much commercial revenue your specific production generates. This transition from "productivity" to "profitability" is the most effective way to justify higher compensation models.
Understanding the 2026 Benchmark: The Professional Fee Component
To use this data effectively, you've got to distinguish between facility fees and professional fees. Facility fees cover hospital overhead, while professional fees represent your specific clinical work. The latest RAND findings, released in the Round 5 report, show that while overall hospital prices average 254% of Medicare, the associated professional services average 184% of Medicare prices. This 1.84x multiplier is the "North Star" for your valuation. With the 2026 Medicare Physician Fee Schedule (PFS) conversion factor finalized at $33.4009 for practitioners not in an APM, you can apply the professional fee multiplier to see the market-clearing price for your work. Even as Round 6 data collection continues through late 2026, these established ratios remain the most authoritative evidence for your professional fee negotiations.
Decoding the Professional Fee Multiplier in RAND Reports
A "multiplier" is a quantitative expression of how much more a private insurer pays compared to the government's baseline. In the context of RAND's hospital price transparency study, this metric represents the average percentage of Medicare that commercial plans pay for the same CPT codes. While the 2026 Medicare Physician Fee Schedule sets the foundation with a conversion factor of $33.4009 for non-APM practitioners, the commercial market operates on a completely different scale. Identifying your specific professional fee ratio is the primary requirement for constructing a physician economic value score that stands up to administrative scrutiny.
Using RAND pricing data for physicians allows you to move beyond the "black box" of hospital contracts. The latest Round 5 data indicates that professional services are reimbursed at an average of 184% of Medicare rates. This multiplier is the lever that converts your clinical output into a dollar-denominated revenue figure. Without this data, you're negotiating in a vacuum, relying on the hospital's internal accounting which often obscures the actual commercial premiums collected on your work.
Specialty-Specific Variations in Commercial Pricing
Multipliers aren't uniform across the medical landscape. Surgical specialties frequently command higher commercial-to-Medicare ratios than primary care due to procedural complexity and the concentration of high-value CPT codes. Market consolidation also plays a significant role. In regions where a single health system dominates, the professional fee negotiation power often shifts, which is reflected in the claims data. By isolating high-volume codes within your specialty, you can determine if your current compensation aligns with the actual receipts the hospital receives from private payers.
National vs. Specialty-Specific Multipliers
A national average can be a misleading benchmark for a high-level professional. While the broad average is 184%, state-level medians vary wildly, ranging from 170% in Arkansas to over 300% in states like California and New York. Relying on a generic national figure might lead you to undervalue your services if you practice in a high-reimbursement market. Granular RAND pricing data for physicians accounts for these geographic adjustments, ensuring your valuation reflects the local economic reality. Accessing a Specialty-Specific Revenue Analysis provides the clarity needed to ensure your contract reflects these nuanced regional benchmarks rather than broad generalizations.
RAND Data vs. MGMA: Why Traditional Surveys Fall Short
Traditional benchmarks like MGMA or SullivanCotter have long served as the primary reference for compensation, but they possess a fundamental limitation: they are a reflection of what physicians are currently paid, not what they actually generate in revenue. These surveys rely on self-reported data provided by hospital administrators, creating a closed loop that often reinforces suppressed market rates. In contrast, RAND pricing data for physicians is derived from actual insurance "receipts." It captures the real-world dollars paid by commercial insurers to providers, offering a transparent view of the system's top-line revenue. This distinction is vital for a successful physician contract negotiation because it shifts the focus from peer averages to your specific economic contribution.
The Flaw in Self-Reported Compensation Data
Survey data is inherently backward-looking. By the time 2025 survey results are published and analyzed, the clinical and economic environment of 2026 has already shifted. This "lag time" puts you at a disadvantage during renewals, especially when significant regulatory updates, such as the CMS hospital price transparency rules, are actively influencing market dynamics. Furthermore, because administrators control the data submission process, there is a risk of selection bias that favors the health system's budgetary goals. Claims-based data remains the gold standard for Fair Market Value (FMV) assessments because it is objective, third-party verified, and tied to actual transaction values rather than administrative estimates.
Moving Beyond the Median: Using RAND to Define Your Ceiling
Health systems frequently use "the median" as a tool to cap physician salaries, suggesting that any compensation above the 50th percentile is an anomaly. However, if your production and the commercial reimbursement rates for your specialty are in the 75th or 90th percentile, accepting median pay results in a massive transfer of value from you to the institution. Using RAND pricing data for physicians allows you to build a case based on revenue reality. If the commercial multiplier in your region is significantly higher than the national average of 184%, you have the objective evidence needed to prove your worth exceeds the standard survey caps. This transparency advantage turns a subjective conversation about "fairness" into an objective discussion about margin and contribution.
- Surveys: Reflect historical averages and administrative reporting.
- RAND Data: Reflects current commercial revenue and actual insurer payments.
- The Result: A negotiation strategy grounded in economic facts rather than institutional preferences.
Step-by-Step: How to Calculate Your Economic Value Using RAND Data
Moving from an intuitive sense of being undervalued to a data-backed negotiation requires a shift in how you view your production. Instead of focusing solely on wRVUs, you must translate your clinical activity into actual dollar-denominated revenue. This process begins by gathering your annual production reports, specifically your total wRVU output and a list of your top 10 most frequent CPT codes. These codes represent the bulk of your economic impact and serve as the testing ground for your valuation model. By applying RAND pricing data for physicians to these high-volume services, you can move beyond the hospital's internal benchmarks and see the actual market-clearing prices for your work.
Finding the Medicare Baseline for Your Services
The first step in your calculation is establishing a Medicare baseline. You should use the CMS Physician Fee Schedule lookup tool, ensuring you filter by your specific geographic location to account for local cost variations. For the 2026 calendar year, the Medicare conversion factor is finalized at $33.4009 for practitioners not participating in an Alternative Payment Model (APM). To find the Medicare rate for a standard Level 4 office visit (CPT 99214), you simply enter the code into the CMS search tool and select your specific Geographic Practice Cost Index locality to see the total price. This number serves as the "1.0" baseline for all subsequent commercial calculations.
Applying the Commercial Multiplier to Your Payer Mix
Once you have your Medicare baseline, you must apply the professional fee multiplier to account for commercial insurance premiums. According to the latest RAND Round 5 data, the average commercial insurer pays 184% of Medicare rates for professional services. However, your true value is a weighted average based on your actual patient population. If your payer mix is 50% Commercial, 40% Medicare, and 10% Medicaid, your weighted revenue formula would look like this:
- Commercial Portion: (Medicare Rate x 1.84) x 0.50
- Medicare Portion: (Medicare Rate x 1.00) x 0.40
- Medicaid Portion: (Medicare Rate x Medicaid Ratio) x 0.10
Summing these figures provides your gross revenue potential. If your current total compensation is significantly lower than this weighted revenue figure, you have a clear, data-driven argument for a salary adjustment. It's also vital to consider that these professional fees are often just the beginning of your value. High-volume proceduralists often generate significant "downstream" revenue for the facility, which further strengthens your position. Using RAND pricing data for physicians allows you to quantify the professional component with clinical precision before even discussing these additional facility-based contributions. To simplify this complex modeling, you can access a Specialty-Specific Revenue Analysis to instantly see how your production aligns with current commercial benchmarks.
Leveraging the Empwr Index: Automating Your Valuation Strategy
The transition from raw data points to a strategic negotiation requires more than just a spreadsheet; it demands a synthesis of clinical production and economic reality. While manually applying RAND pricing data for physicians provides a foundational understanding of your worth, the complexity of 2026 reimbursement models often necessitates a more sophisticated approach. Empwr Medical bridges this gap by translating dense RAND and CMS datasets into a single, actionable Empwr Index score. This proprietary metric simplifies the valuation process by automating the revenue calculation, ensuring that every CPT code and wRVU is weighted against the most current commercial-to-Medicare multipliers and geographic adjustments.
Our Physician Economic Value Platform is designed to handle the heavy lifting of data science so you can focus on clinical excellence. By accounting for specialty-specific workflows and the nuanced shifts in the 2026 Medicare Physician Fee Schedule, the platform provides a level of precision that manual modeling cannot match. You receive a comprehensive Specialty-Specific Revenue Analysis that serves as an objective, third-party valuation. This document moves the conversation away from emotional appeals and toward a proactive strategic plan grounded in verified financial receipts.
The Empwr Index vs. Raw Data
Busy clinicians don't have the time to audit billions of rows of claims data or track every adjustment to the Medicare conversion factor. The Empwr Index simplifies this "RAND to revenue" translation, providing a clear benchmark that reflects your specific market position. Having a physician-led team audit your economic value adds a layer of professional advocacy that resonates with hospital leadership. A formal Empwr Index Report carries significantly more weight in a hospital C-suite than a self-generated spreadsheet because it represents a rigorous, standardized methodology. It signals to administrators that you are approaching the renewal process with the same clinical precision you apply to patient care.
Next Steps: Preparing for Your Next Negotiation
Presenting RAND-backed data to a department chair or CEO requires a shift in posture. Instead of asking for a raise, you are presenting an evidence-based case for a market-clearing compensation rate. Use your contribution margin to negotiate not just for salary, but for the staffing and resources necessary to maintain your high-value production. When you can prove that your professional fees generate revenue at 184% or even 300% of Medicare rates, the conversation about resource allocation becomes much easier for the administration to justify. You can calculate your physician economic value with Empwr Medical today to ensure you enter your next contract discussion with total clarity and quiet confidence.
Securing Your Professional Worth with Data-Backed Clarity
Securing your professional value requires moving beyond the traditional reliance on self-reported surveys. You now understand that the true measure of your economic impact lies in the actual commercial receipts revealed by the latest transparency studies. By integrating RAND pricing data for physicians into your negotiation strategy, you shift the burden of proof from administrative assumptions to objective market reality. This transparency ensures your compensation reflects the 184% professional fee multiplier and the specific revenue you generate for your health system.
Empwr Medical provides the tools to automate this complex modeling. As a physician-founded and led organization, we utilize proprietary analysis of RAND and CMS data to deliver specialty-specific revenue modeling tailored to your unique practice profile. You don't have to navigate these dense datasets alone. Take the next step toward an informed conversation about your clinical contributions.
Get Your Personalized Empwr Index Report Now and enter your next contract renewal with the quiet confidence that only data-backed clarity can provide. You've dedicated your career to clinical excellence; it's time your contract reflected that commitment.
Frequently Asked Questions
Is RAND pricing data publicly available for all physicians?
Yes, the RAND Corporation publishes its comprehensive research reports online for public access at no cost. While the raw claims data behind these reports is typically restricted to researchers and participating employers, the summary reports provide the essential commercial-to-Medicare ratios. Physicians can use these published benchmarks to find state-level medians and professional fee multipliers relevant to their specific region.
How often is the RAND hospital price transparency study updated?
The study is updated periodically to reflect shifting market dynamics, with the Round 5 report published in December 2024. Round 6 is currently in the data collection phase, covering claims from 2023 through 2025, with a public report expected in September 2027. These multi-year cycles ensure the data remains a robust reflection of long-term commercial reimbursement trends across the country.
What is the difference between a facility fee and a professional fee in RAND data?
Facility fees represent the operational costs of the hospital or clinic, while professional fees cover the specific clinical work performed by the practitioner. RAND pricing data for physicians isolates the professional fee component, which typically carries a different multiplier than facility services. Distinguishing between these two is vital because your contract negotiation should focus on the professional revenue your work generates.
Can I use RAND data if I am in a private practice instead of a hospital?
You can certainly use these multipliers as a market benchmark regardless of your employment model. While the study focuses on services tied to hospital systems, the professional fee ratios provide a reliable "market-clearing price" for commercial reimbursement. This data helps private practices verify that their payer contracts and internal compensation models align with broader regional standards for professional services.
Does the RAND multiplier include Medicare Advantage and Medicaid plans?
No, the RAND study specifically analyzes commercial insurance prices relative to traditional Medicare fee-for-service rates. Medicare Advantage and Medicaid plans operate under separate regulatory frameworks and are excluded from these specific commercial-to-Medicare ratios. The goal of the study is to provide transparency into what private, employer-sponsored health plans pay for professional and facility services.
How do I find the specific commercial-to-Medicare ratio for my specialty?
You should review the granular data tables within the RAND reports that categorize professional services by specialty and service type. Because the broad national average doesn't account for specialty-specific nuances, you'll need to look for benchmarks that match your specific CPT code profile. Using a Specialty-Specific Revenue Analysis can help translate these dense datasets into a precise revenue model for your practice.
What should I do if my employer refuses to recognize RAND data in negotiations?
Shift the conversation toward the objectivity of claims-based data compared to the potential bias of self-reported surveys. If an administrator dismisses RAND pricing data for physicians, ask them to provide their own transparency regarding the actual commercial receipts for your clinical volume. Using objective third-party data forces the health system to justify their valuation with verified financial facts rather than internal budgetary caps.
How does Empwr Medical use RAND data differently than other platforms?
Empwr Medical doesn't just display raw data; it integrates these benchmarks into a personalized economic profile. Our platform combines the latest professional fee multipliers with your specific production and geographic adjustments. This process generates the Empwr Index, a single score that quantifies your true contribution margin. It's a tool designed specifically for individual practitioners to lead informed, data-backed conversations during contract renewals.