

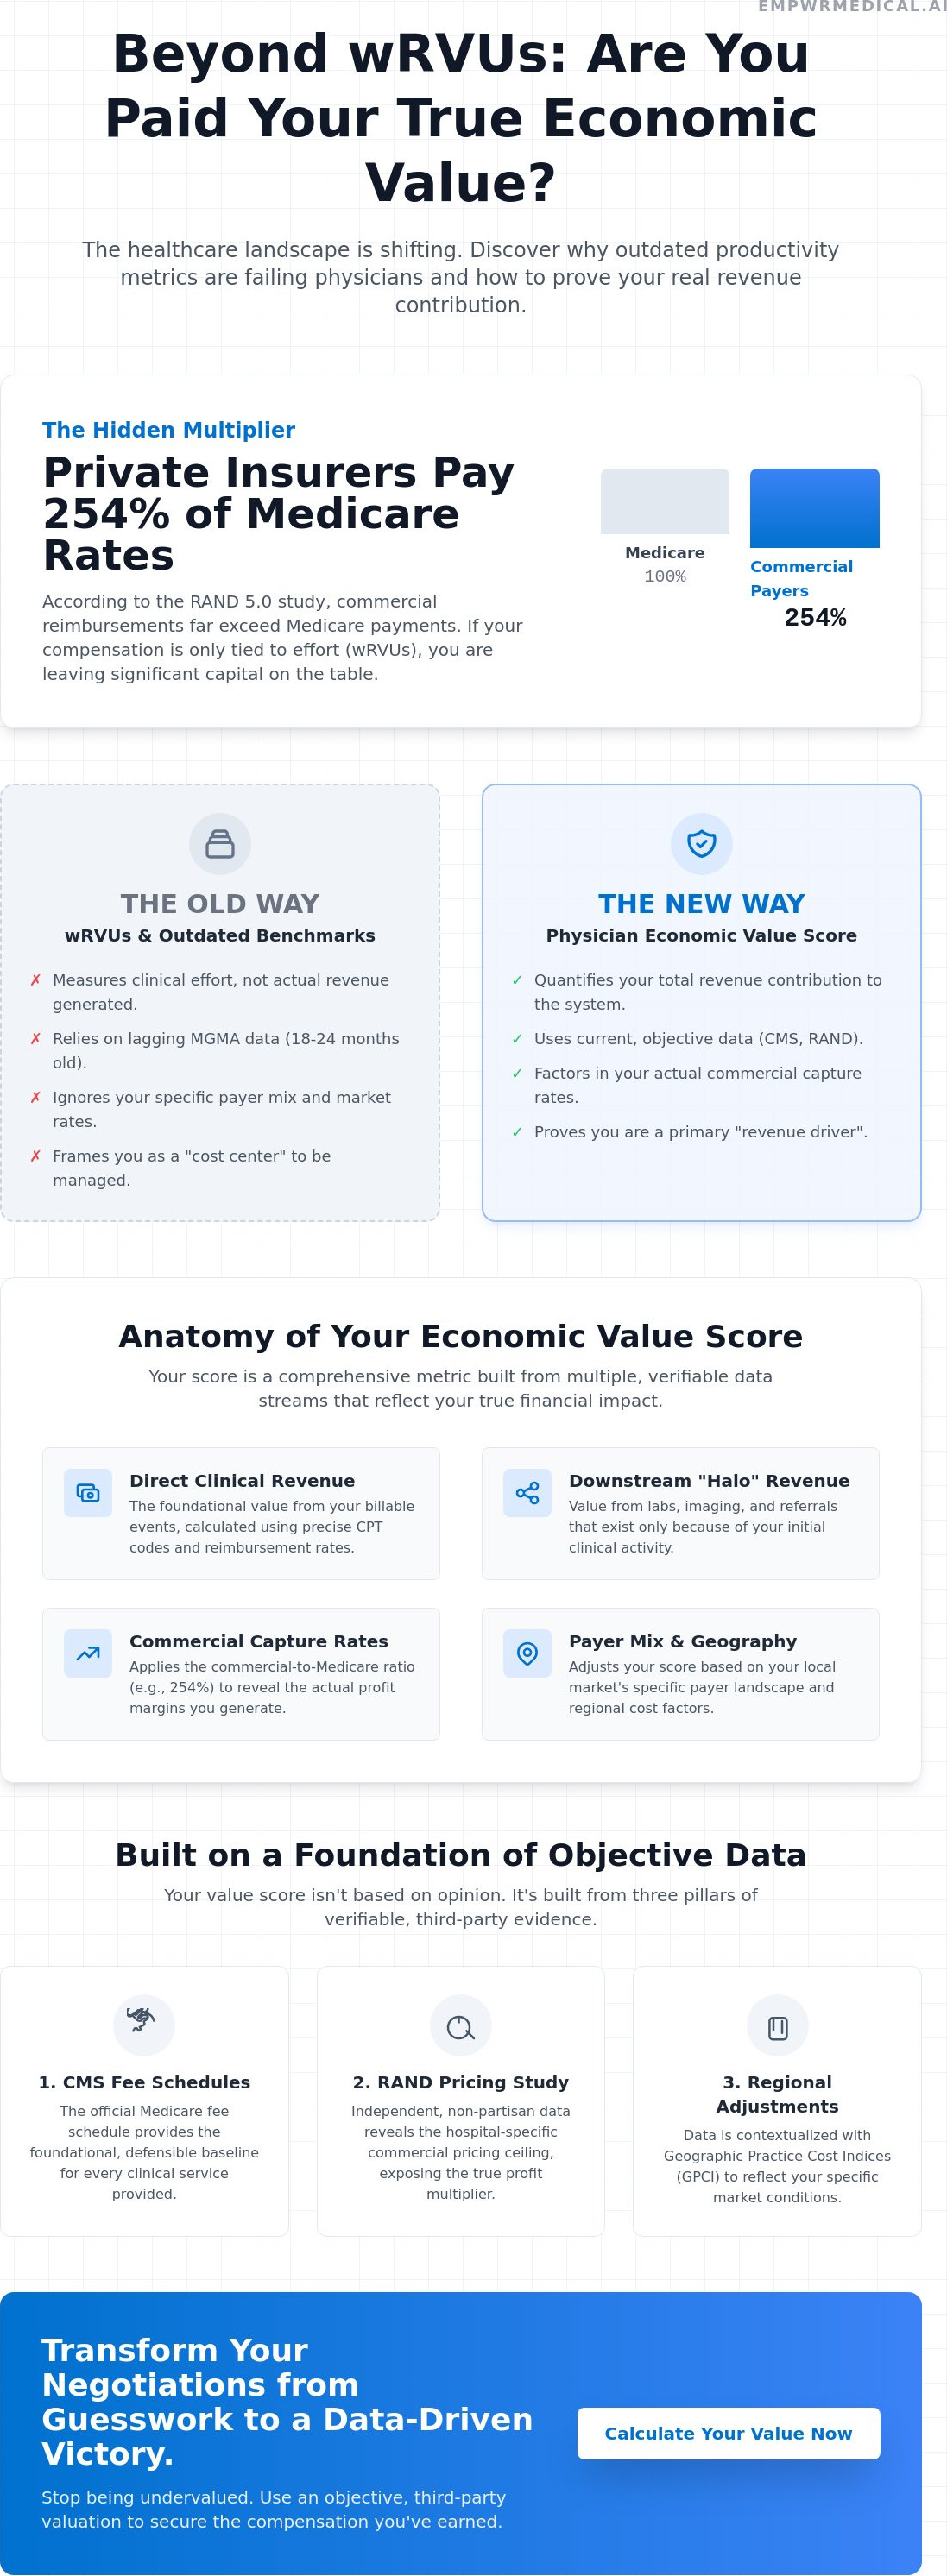
According to the RAND 5.0 study, private insurers paid an average of 254% of what Medicare would have paid for the same hospital services in 2022. Despite this, most hospital systems continue to anchor compensation to outdated MGMA benchmarks that fail to account for these massive commercial-to-Medicare price ratios. If you're still relying on wRVUs alone to prove your worth, you're likely leaving significant capital on the table. Understanding your physician economic value score is no longer a luxury; it's a requirement for professional survival in 2026.
You probably feel the tension every time you enter a contract renewal meeting. You know your clinical volume is high, but the administration uses opaque data to claim your department's margins are thin. It's frustrating to feel like a cost center when you know you're a primary revenue driver. This article will show you how to calculate and leverage your individual economic value score to transform your next negotiation from a guessing game into a data-driven victory. We'll explore how to integrate the 2026 Medicare Physician Fee Schedule and commercial payor data to build a transparent, authoritative case for your true clinical impact.
Key Takeaways
- Identify the limitations of productivity-based metrics and why quantifying your total revenue contribution is essential for top-tier professionals.
- Learn to leverage objective data sources like the 2026 CMS Fee Schedule to establish a firm financial baseline for your clinical work.
- Understand how your physician economic value score serves as a strategic North Star, providing a single, defensible number to guide your professional planning.
- Discover the methodology for presenting an Empwr Index Report as an objective, third-party valuation during contract negotiations.
- Gain insight into how the Physician Economic Value Platform provides real-time clarity by translating complex clinical data into actionable revenue projections.
Beyond wRVUs: Defining the Physician Economic Value Score
The healthcare industry is undergoing a fundamental shift in how it assesses professional contribution. For decades, the standard has been the wRVU, a metric derived from the Resource-Based Relative Value Scale (RBRVS). While this system effectively measures clinical effort, it fails to account for the actual dollars entering a hospital's bank account. By 2026, relying solely on wRVUs is no longer sufficient for high-performing clinicians. A physician economic value score provides a more accurate alternative. It is a quantified metric of a clinician's total revenue contribution. It translates clinical volume into financial reality by factoring in payer mix, geographic location, and specialty-specific commercial capture rates.
The transition from volume-based compensation to value-based economic profiling requires a deep understanding of how revenue is actually generated. A physician practicing in a market characterized by elevated commercial reimbursement rates, where hospital prices can exceed 300% of Medicare rates according to RAND data, has a vastly different economic profile than one in a region with a different payer landscape. Your score accounts for these nuances. It ensures that your local market reality is reflected in your professional valuation rather than being buried in a system designed for institutional convenience.
The Limitation of Traditional Benchmarks
Hospital administrators often use MGMA or SullivanCotter data to set compensation ceilings. These benchmarks rely on self-reported, retrospective data that often lags behind current market conditions by eighteen to twenty-four months. This delay creates a significant disadvantage for physicians in high-growth areas or those with a favorable commercial payer mix. When you're compared to a national average, your individual performance is diluted. If you generate revenue that far exceeds the median, an average benchmark becomes a tool for administration to cap your earnings. It doesn't reward your actual impact; it merely manages the hospital's payroll expenses.
The Components of a Modern Value Score
A sophisticated economic profile looks beyond the immediate billable event. It incorporates direct clinical revenue and the halo effect. This includes downstream revenue from labs, imaging, and referrals that wouldn't exist without your clinical activity. Modern modeling also accounts for the contribution margin. This is the revenue remaining after direct variable costs are subtracted. According to the RAND 5.0 study, commercial insurers pay an average of 254% of Medicare rates. A physician economic value score integrates these commercial-to-Medicare ratios to reveal the hidden profit margins that hospitals often keep opaque. Transparency in these capture rates is the new frontier for physician advocacy. It allows you to walk into a C-suite meeting with a defensible, data-backed demand that is grounded in operational reality.
The Rigorous Data Behind Your Value Score
A defensible negotiation requires more than just high productivity; it demands an audit trail of verifiable data. To build a valid physician economic value score, one must move beyond internal hospital spreadsheets. The methodology relies on three pillars of objective evidence: federal reimbursement schedules, independent pricing studies, and regional cost adjustments. This approach ensures that every dollar claimed in a negotiation is rooted in established economic standards rather than administrative discretion.
CMS Fee Schedules: The Defensible Baseline
The 2026 Official Medicare Physician Fee Schedule serves as the foundational baseline for all calculations. By utilizing current CMS data, the model translates specific CPT codes into precise reimbursement estimates. This process is more granular than simply looking at how RVUs are calculated; it applies the actual dollar conversion factors set for the current year. Using public data creates a level playing field. It's difficult for a C-suite executive to dismiss figures that are pulled directly from the same federal sources they use to project their own system's revenue.
RAND Pricing and Commercial Modeling
While CMS data provides the floor, the RAND Hospital Pricing Transparency Study (Round 5) provides the ceiling. This study is critical because it reveals the commercial-to-Medicare price ratios that hospitals often keep confidential. In 2022, the national average for private insurance payments was 254% of Medicare rates. However, state-level data shows even more dramatic variations. In states like Florida, California, or New York, these prices often exceed 300% of Medicare rates. A robust physician economic value score incorporates these ratios to model your specific payer mix. If your patient panel is 60% commercial insurance, your economic impact is vastly higher than a simple Medicare-based calculation would suggest.
Regional accuracy is further refined through Geographic Practice Cost Indices (GPCI). These indices adjust for the varying costs of operating a practice, including labor and rent, in different parts of the country. Location-adjusted data is non-negotiable. A neurosurgeon in Manhattan faces different economic realities than one in rural Ohio. By accounting for these factors, the Empwr Index ensures your valuation is specialty-specific and geographically precise. For those ready to see these data points applied to their own practice, the Physician Economic Value Platform offers a streamlined way to generate these insights in real-time.
Transparency is the ultimate leverage. When you understand the mechanics of how clinical work is converted into institutional profit, the power dynamic shifts. You aren't asking for a compensation adjustment based on "hard work" or "loyalty." You're presenting a data-backed analysis of captured revenue. This level of rigor transforms the conversation from a subjective plea into a professional business transaction.
Understanding the Empwr Index: Your Economic North Star
The Empwr Index is the synthesis of the complex data points discussed previously, providing a single, defensible number that represents your professional standing. Unlike broad industry reports that analyze The National Economic Impact of Physicians on a macro scale, this index is a personal economic profile. It functions as a North Star, guiding your career decisions and contract discussions by translating clinical effort into a physician economic value score that is impossible to ignore. By balancing clinical volume, specialty-specific reimbursement, and regional market positioning, the index anchors every professional conversation in objective reality.
This metric also facilitates a multi-year comparison of your professional growth. Tracking your value trajectory over time allows you to see how shifts in your practice patterns or changes in regional commercial pricing affect your bottom-line impact. It moves the discussion away from a one-time salary "ask" toward a long-term strategic partnership between the clinician and the institution.
Contribution Margin vs. Gross Revenue
While gross revenue represents the total billings generated, hospitals prioritize the contribution margin. This is the revenue remaining after variable costs, such as medical supplies and direct clinical support staff, are subtracted. It's the most accurate reflection of the profit you generate for the system. If you can demonstrate that your individual margin is significantly higher than the departmental average, you have a logical, data-backed justification for higher base compensation or performance-based bonuses. Understanding this distinction allows you to speak the financial language of the C-suite, proving that you aren't just a cost center, but a primary driver of institutional stability.
Interpreting Your Empwr Index Score
Your index score acts as a diagnostic tool for your career. A score that sits significantly above the market average suggests you have immense leverage in your current environment. Conversely, if your wRVU counts are high but your physician economic value score is lower than expected, it often indicates "revenue leakage." This might stem from an unfavorable payer mix, poor capture of specialty-specific workflows, or systemic billing inefficiencies that the wRVU model fails to detect. By identifying these gaps, you can advocate for better administrative support or clinical resources that align with the actual revenue you generate. The score ensures that high-complexity work, which often requires more time but doesn't always yield more wRVUs, is finally quantified and rewarded.
Strategic Application: Using Your Score in Contract Negotiations
Entering a contract negotiation without a physician economic value score is like trying to value a business without a balance sheet. You're forced to rely on the hospital's version of your worth; a version often skewed by institutional overhead and generalized benchmarks. To secure a contract that reflects your true impact, you must transform the meeting into a data-driven business review. This shift moves you from a position of requesting a favor to one of presenting a professional case for equitable compensation.
Step 1 involves preparation. Before your initial meeting, generate a Specialty-Specific Revenue Analysis. This provides the granular detail needed to move beyond wRVU counts. Step 2 is the presentation. Position the Empwr Index as an objective, third-party valuation. This removes the personal friction from the negotiation; it makes it a discussion about market-verified data rather than personal demands.
Step 3 requires pivoting the conversation. Administrators will likely start with salary surveys. Your job is to shift the focus to actual revenue generation. If you're generating 254% of Medicare rates through commercial contracts, as the RAND 5.0 study suggests is the national average, your value far exceeds what an MGMA median implies. Step 4 uses your contribution margin to neutralize overhead arguments. When a hospital claims you're expensive to employ, show them the margin you provide after those costs are paid. Finally, Step 5 is securing the deal. Use this clarity to anchor your demands in the revenue you've already proven you capture.
The 'Data-First' Opening Statement
Your opening sets the tone. Instead of discussing what you hope to earn, lead with your physician economic value score. Use precise phrasing: "Based on the 2026 CMS Fee Schedule and regional commercial-to-Medicare ratios, my clinical work generates $X in annual revenue, and my current compensation captures only Y% of that value." This avoids the emotional trap of feeling undervalued. It replaces feelings with financial facts that the administration already recognizes in their own accounting systems.
Overcoming Common Administrative Objections
Expect pushback. Administrators often say, "Our budget is based on MGMA averages." Your response should be steady: "Averages include clinicians with vastly different payer mixes and geographic constraints; this report utilizes location-adjusted data specific to our market." If they claim they don't share internal margin data, use the Empwr Index to provide a defensible estimate. You aren't guessing; you're using RAND-backed modeling to prove your ROI. This level of transparency makes it difficult for them to justify capping your earnings based on outdated, generalized data.
The Empwr Medical Platform: Real-Time Economic Clarity
The Physician Economic Value Platform serves as the technical bridge between raw clinical data and professional advocacy. It synthesizes the variables we've discussed; the 2026 CMS conversion factors, RAND commercial-to-Medicare ratios, and regional GPCI adjustments; into a single, actionable physician economic value score. This isn't a generic calculator. It's a specialized economic engine built by physicians who understand that clinical work is often lost in translation when viewed through a purely administrative lens. By accounting for specialty-specific workflows, the platform ensures that high-complexity care is finally quantified accurately.
Maintaining 2026 standards requires constant data integration. The platform provides real-time updates to reflect the most current federal reimbursement shifts and commercial pricing trends. This ensures your valuation isn't based on last year's reality but on the current fiscal environment. While individual clinicians use these reports for personal contract renewals, the platform also offers enterprise-level insights for medical groups. This allows group leaders to perform strategic planning, ensuring their entire team's compensation structure is grounded in the actual revenue they capture for the system.
Clarity in a Complex System
Hospital finance is frequently treated as a "Black Box." Revenue enters the system, but the specific margins generated by individual clinicians are often obscured by layers of institutional overhead and indirect costs. Empwr opens this box. By providing transparent, location-adjusted data, the platform acts as your most objective advocate. There's a significant psychological advantage to this level of insight. When you know your true worth before you speak, you eliminate the anxiety of the unknown. You aren't entering a negotiation to ask for a salary; you're entering a business meeting to discuss a professional partnership based on verified financial evidence.
Getting Started with Your Empwr Index Report
The process of moving from clinical data to a defensible report is streamlined to respect your time. After entering your specialty, location, and clinical volume, the platform generates a comprehensive Specialty-Specific Revenue Analysis. This report includes your projected gross revenue, a detailed contribution margin, and your final Empwr Index score. It's a decision-ready document designed to be shared directly with C-suite executives or compensation committees. It provides the transparency needed to move the conversation forward with confidence and rigor. You don't have to wait for the administration to tell you what you're worth.
Calculate your Physician Economic Value Score now with Empwr Medical.
Reclaiming Your Professional Agency
The transition from productivity-based metrics to a comprehensive economic profile is the most significant strategic move you can make for your career in 2026. By moving beyond the limitations of the wRVU system, you gain the clarity required to advocate for your true clinical impact. We've explored how objective data, including 2026 CMS Fee Schedules and RAND pricing data, can be synthesized into a single, defensible physician economic value score. This score serves as more than just a number; it's a tool for informed, professional conversations that respect your contribution to the hospital's bottom line.
Transparency shouldn't be a one-way street. As a physician-founded organization, Empwr Medical is dedicated to providing the specialty-specific and location-adjusted accuracy you need to anchor your next negotiation in reality. You don't have to rely on outdated benchmarks or administrative opacity to determine your worth. The data is available, and the methodology is rigorous.
Start Your Physician Economic Value Analysis Today and transform your professional trajectory with data-backed confidence. You've done the clinical work; it's time to ensure your contract reflects the full scope of your impact.
Frequently Asked Questions
What exactly is a Physician Economic Value Score?
A Physician Economic Value Score is a proprietary, quantified metric that represents a clinician's total revenue contribution to a healthcare system. It moves beyond simple productivity counts by translating clinical volume, payer mix, and regional reimbursement rates into a single, defensible dollar-value impact. This score provides the objective clarity needed to anchor professional discussions in financial reality rather than administrative estimates.
How is the Empwr Index different from an MGMA salary benchmark?
Unlike MGMA benchmarks, which rely on retrospective, self-reported survey data that often lags behind market shifts, the Empwr Index uses real-time, location-adjusted data. It accounts for the specific commercial-to-Medicare price ratios in your region, such as the 254% national average identified by RAND. This ensures your valuation reflects your actual revenue generation rather than a generalized national median.
Is the data used for my value score defensible in a legal or professional negotiation?
Yes, the data is highly defensible because it's derived from authoritative, public sources such as the 2026 CMS Physician Fee Schedule and the RAND Hospital Pricing Transparency Study. By using the same federal and independent data points that hospital systems use for their own financial projections, you eliminate the subjectivity often found in traditional salary negotiations. It transforms the conversation into a professional business review.
Can I use my Physician Economic Value Score if I work in a private practice?
Absolutely. While often used for hospital employment negotiations, the physician economic value score is equally valuable for private practice owners. It helps you understand your individual contribution margin and identify revenue leakage within your own billing cycles. This data allows you to optimize your payer mix and make informed decisions about resource allocation or partnership distributions based on actual economic impact.
How often should I update my physician value analysis?
You should update your analysis at least annually or whenever there is a significant shift in your clinical workflow or regional reimbursement landscape. CMS updates the Physician Fee Schedule every year, and commercial price ratios fluctuate based on local market dynamics. Keeping your analysis current ensures that your professional valuation remains accurate for 2026 standards and beyond, providing a steady baseline for strategic career planning.
Does the score take my specific medical specialty into account?
Yes, the Physician Economic Value Platform is designed to provide specialty-specific accuracy. Different medical specialties have unique CPT code distributions, supply costs, and commercial capture rates. The platform accounts for these nuances, ensuring that the final score reflects the specific economic realities of your field, whether you're in a high-volume primary care setting or a high-complexity surgical specialty.
What data sources are used to calculate the Physician Economic Value Score?
The platform utilizes three primary pillars: the 2026 Official Medicare Physician Fee Schedule, the RAND Hospital Pricing Transparency Study, and regional Geographic Practice Cost Indices. These sources are combined with your specific clinical volume and payer mix to generate a precise physician economic value score. Every data point is verifiable, ensuring transparency throughout the calculation process.
Will my employer be able to see my Empwr Index score?
No, your employer cannot see your score unless you choose to share it. The platform is designed as a private advocacy tool for individual physicians. You maintain full control over your data and the final Empwr Index Report. This allows you to review your economic impact privately and decide exactly how and when to present this information during a contract renewal or professional review meeting.