

What if the metric your hospital uses to calculate your bonus is the same one they use to hide your true profitability? Many physicians feel like cogs in a relentless wheel of production, especially as CMS implements a 2.5% efficiency adjustment to work units for 2026. You likely feel the pressure of rising productivity requirements, but without understanding the nuances of contribution margin vs wRVU, you're navigating your career with only half the map. It's frustrating to see median physician subsidies climb to $315,358 while your own compensation feels disconnected from the actual profit you generate for the system.
We agree that relying solely on production units is an incomplete way to measure your professional worth in a corporate healthcare environment. This article will show you how to move beyond simple effort and start quantifying your true economic value. You'll learn how to decode the metrics administrators use to evaluate your department and how to obtain the data necessary to negotiate a more favorable conversion factor. We'll explore how identifying high-value clinical activities can transform your next contract negotiation into a strategic, data-driven conversation about your impact.
Key Takeaways
- Understand how the distinction of contribution margin vs wRVU allows you to transition from measuring simple clinical effort to quantifying your actual impact on health system profitability.
- Learn why standardized wRVU conversion factors often overlook market-specific revenue growth and site-of-service differentials that significantly increase hospital revenue.
- Identify how to isolate Net Patient Service Revenue (NPSR) from variable costs to reveal the "secret metric" administrators use to assess your department's viability.
- Evaluate your "Profit-to-Work Ratio" to determine if your current compensation reflects your status as a high-value asset or if you're being underpaid relative to your economic contribution.
- Discover how the Empwr Index Report serves as a bridge between your clinical workload and your professional wealth during complex contract discussions.
The Evolution of Physician Value: Moving Beyond wRVUs to Contribution Margin
The traditional framework for assessing physician worth is undergoing a fundamental transformation. For decades, the industry has relied on volume-based metrics to define productivity. However, the current economic climate requires a more sophisticated lens. Understanding the distinction between contribution margin vs wRVU is no longer optional for physicians who want to protect their professional standing. While one measures the intensity of your labor, the other measures the financial viability of your practice within a larger system.
The wRVU represents clinical effort. It is a standardized unit designed to quantify the time and technical skill required to perform a service. In contrast, the physician contribution margin represents economic impact. It is calculated by taking the net revenue your services generate and subtracting the direct variable costs, such as medical supplies and clinical staff, required to deliver that care. This shift from effort to impact is the defining trend of 2026.
The wRVU Standard: Measuring Clinical Effort
The healthcare industry adopted Relative Value Units (RVUs) as a way to create a uniform language for medical work. Under the Resource-Based Relative Value Scale (RBRVS), each CPT code is assigned a value based on three components: physician work, practice expense, and malpractice risk. This system was intended to level the playing field, ensuring that a minute of work in one specialty was theoretically equivalent to a minute in another.
Health systems prefer wRVUs because they are administratively simple. They provide a clean, objective number that ignores the messy realities of insurance negotiations and payer mixes. However, this simplicity creates a productivity trap. As CMS implements a -2.5% efficiency adjustment to work units in 2026, physicians find themselves working harder just to maintain baseline compensation. This focus on top-line activity ignores whether that activity actually supports the organization's financial health.
The Contribution Margin Shift: Measuring Economic Impact
While you are focused on your wRVU targets, hospital administrators are looking at your contribution margin. This metric reveals your bottom-line value. It accounts for the actual reimbursement rates your specific payer mix provides, which wRVUs completely ignore. If you see a high volume of patients with favorable private insurance, your economic value is significantly higher than your wRVU total suggests.
Hospitals often keep these figures opaque. By keeping physicians focused on production units, they can capture the downstream revenue and favorable margins without adjusting compensation accordingly. A physician with moderate wRVU output but a high contribution margin is often more valuable to a system than a high-volume producer with high overhead costs. Transitioning to a margin-based perspective allows you to move from being a cog in the wheel to a strategic partner who understands their true economic worth.
Why wRVUs Alone Fail to Capture Your Full Economic Value
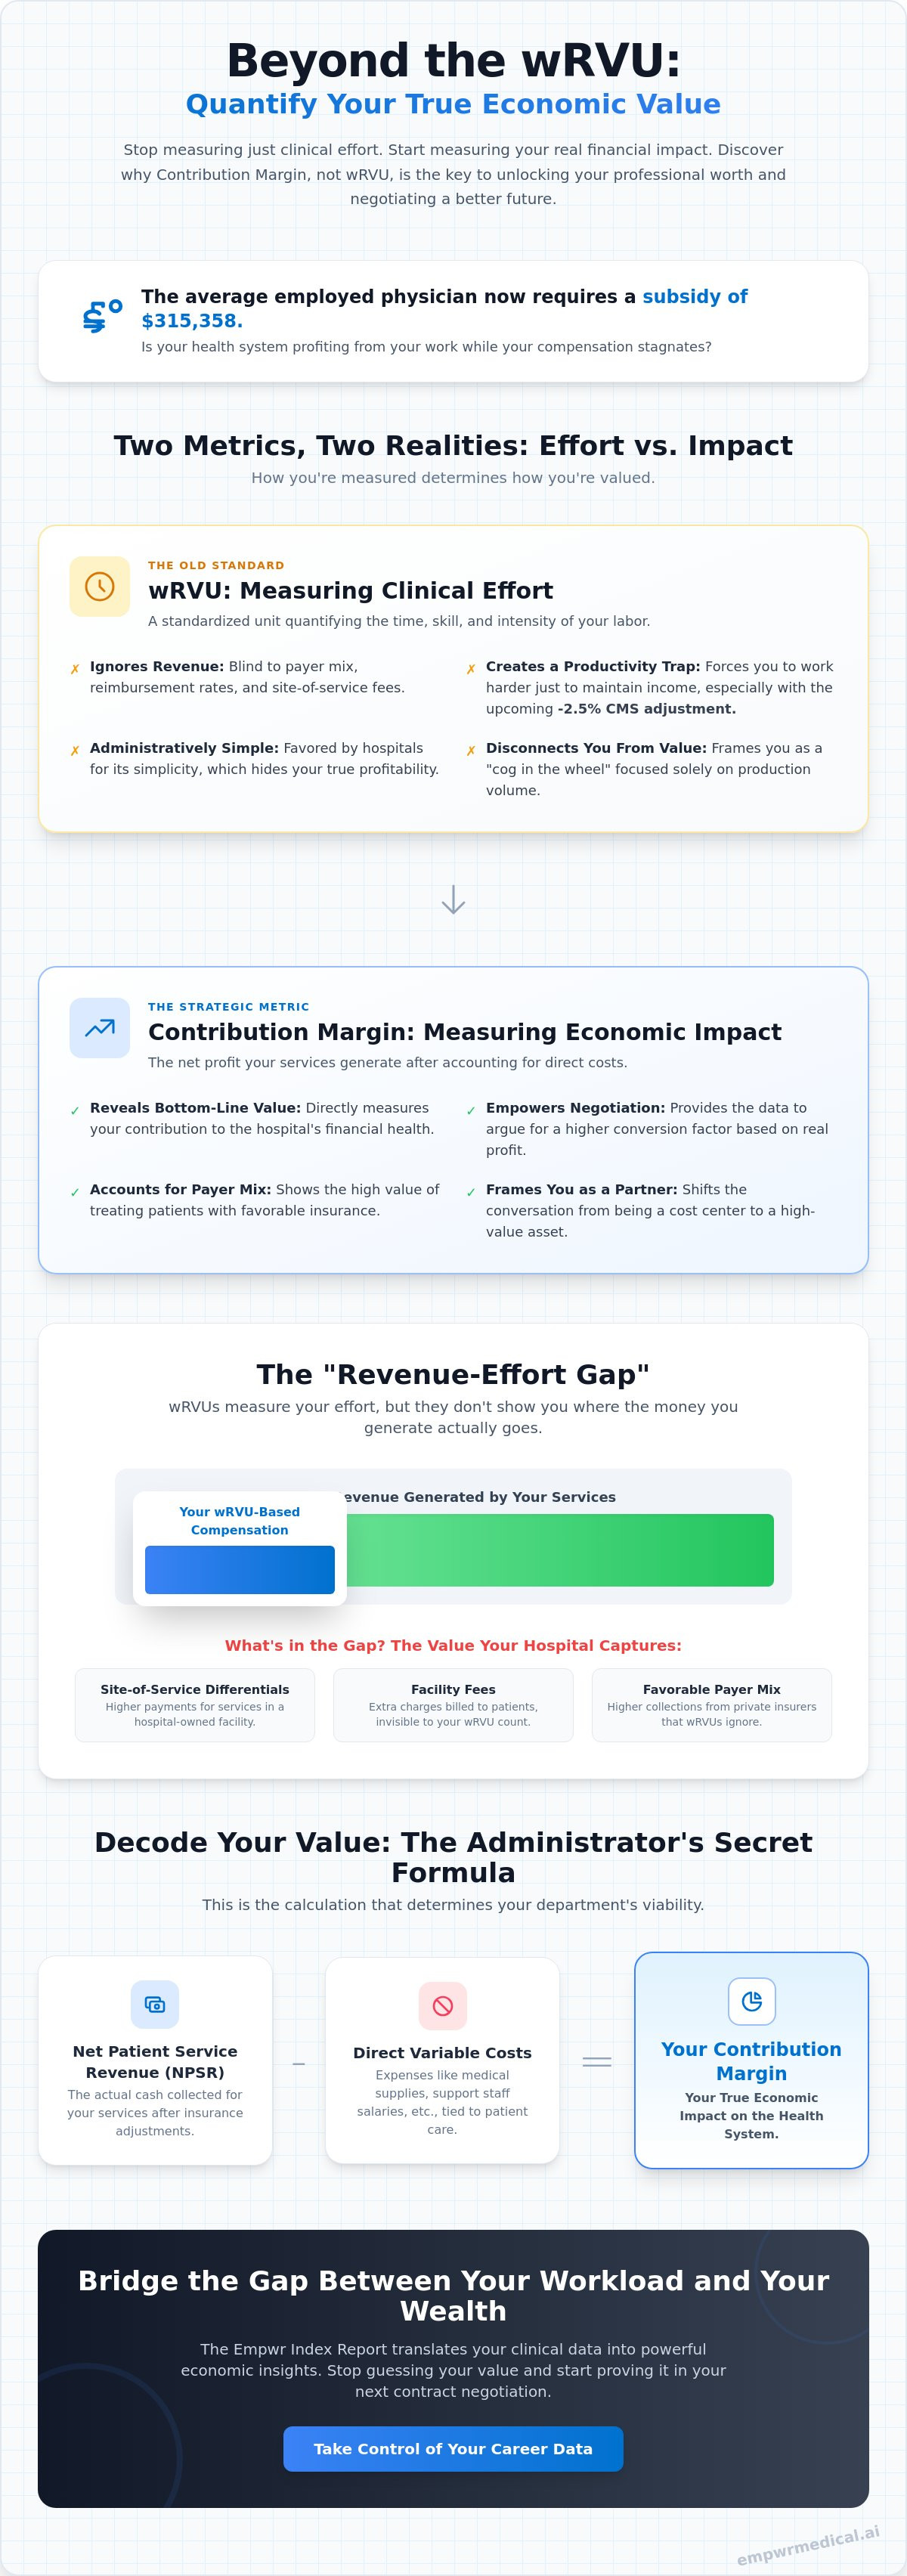
The wRVU system was designed to create a standard unit of measure, but it operates in a vacuum that ignores external market forces. While the CMS conversion factor for 2026 is set at $33.40 for non-qualifying APM participants, this figure is a product of legislative math rather than the actual economic value your services command in the private market. This discrepancy creates a "revenue-effort gap," which is the delta between the compensation you receive per unit of work and the total collections the hospital secures from that same effort. When physicians focus strictly on production units, they often overlook how much of their generated value is being siphoned off by the system's administrative overhead.
Hospitals capture significant revenue through site-of-service differentials and facility fees that are completely invisible to the wRVU calculation. For example, a procedure performed in a hospital-based outpatient department generates a facility fee that often exceeds the professional fee, yet the physician's wRVU remains the same regardless of the location. By ignoring these variables, the wRVU model forces physicians onto a treadmill where they must work harder to combat the -2.5% efficiency adjustment CMS implemented for 2026. This focus on volume fails to reward the strategic value of downstream revenue, such as ancillary imaging and laboratory referrals, which are critical to a system's margin.
The Limitations of the RVU Conversion Factor
The conversion factor is essentially a political lever used to control federal spending, not a reflection of the rising costs of practicing medicine. While the conversion factor saw a modest increase in 2026, it hasn't kept pace with the inflationary pressures on practice expenses and labor. Understanding physician relative value units explained reveals that if your contract is tied solely to these static numbers, you're effectively accepting a real-dollar pay cut every year that inflation outpaces the conversion factor. This creates a scenario where your clinical effort remains high while your economic purchasing power steadily erodes.
How Specialty and Payer Mix Distort wRVU Value
Payer mix is the most significant factor that the contribution margin vs wRVU comparison brings to light. A physician in a high-RVU specialty might appear productive on paper, yet if their payer mix is predominantly public, their actual contribution to the hospital’s bottom line may be lower than a colleague in a low-RVU specialty with high private-payer volume. Private contracts often utilize pricing models that pay multiples of Medicare rates, creating massive margins that the wRVU scale cannot detect.
This complexity is why Decoding Your True Economic Value requires looking at the actual net revenue per encounter. Relying on a Specialty-Specific Revenue Analysis ensures you aren't leaving money on the table by ignoring the specific contract nuances of your local market. Without this data, you're negotiating in the dark, unable to prove why your moderate RVU output actually generates superior financial results for the organization.
Deciphering the Contribution Margin: The Hospital’s Secret Metric
While physicians are often steered toward wRVU targets, hospital administrators are primarily focused on a metric that rarely appears in employment contracts: the contribution margin. This figure represents the actual profit your clinical activity generates before the system applies broad, indirect overhead costs like hospital administration salaries or building maintenance. Understanding the interplay of contribution margin vs wRVU is essential because it reveals whether you are a financial anchor for the organization or a high-yield producer whose value is being obscured by opaque accounting practices.
The calculation begins with your Net Patient Service Revenue (NPSR), which is the actual cash collected for your services rather than the "gross charges" that often exist only on paper. From this revenue, the system subtracts your direct variable costs. These are expenses that fluctuate based on your volume, such as medical supplies, implants, and the salaries of the clinical staff dedicated to your practice. By isolating these figures, the hospital determines how much "margin" your work contributes toward covering the facility's fixed costs, such as rent and heavy imaging equipment.
In 2026, administrators are also scrutinizing "leakage" and "keepage" as part of your total economic profile. If you perform a procedure but the patient goes elsewhere for their post-operative physical therapy or follow-up imaging, that "leakage" represents lost revenue for the system. Conversely, high "keepage" means you are a central hub for the hospital's ancillary services, significantly increasing your contribution margin even if your wRVU output remains steady.
The Physician Contribution Margin Formula
Calculating your value requires a methodical approach. You can start by using the physician contribution margin formula to estimate your standing. This process involves aggregating your annual collections and subtracting your direct expenses, including your own salary and benefits. To ensure accuracy, you should cross-reference your internal data with CMS and RAND benchmarks, which provide a realistic view of market-specific reimbursement rates. Only direct clinical costs should be deducted; you should never be penalized for the "fixed costs" of a hospital wing you don't manage.
Why Health Systems Prioritize Margin Over Volume
The transition to value-based care has made pure volume a risky metric for hospitals. With median hospital operating margins hovering at a fragile 1.9% as of February 2026, systems can no longer afford to subsidize departments that don't generate a positive margin. Many organizations use profitable surgical or specialty lines to cover the losses in primary care or emergency medicine. If you are in a high-margin specialty, your data is the only tool that can prove you are subsidizing other parts of the enterprise. Accessing accurate physician fair market value data ensures that your compensation reflects this reality, preventing you from being undervalued in a landscape where every dollar of margin is being tracked.
Strategic Negotiation: Leveraging Your Contribution Margin in 2026
Negotiating a contract in 2026 requires moving beyond the defensive posture of justifying wRVU volume. When you understand the nuance of contribution margin vs wRVU, you shift the dialogue from "how much I work" to "how much I contribute." This transition is essential for establishing a partnership-based relationship with hospital leadership. By identifying your "Profit-to-Work Ratio," you can demonstrate if you're an over-performer who is currently being underpaid relative to the net collections you secure for the system.
This data also serves as an objective justification for operational requests. If you can show that your contribution margin is high but limited by outdated equipment or insufficient staffing, you're no longer asking for a favor. You're presenting a business case for increasing the system's overall profitability. Hospitals with fragile margins are more likely to invest in providers who can prove their economic impact with clinical precision.
Converting Margin Data into Contractual Leverage
The most effective way to present this data is through a structured "Value Memo." This document should lead with your physician economic value score, providing a clear benchmark of your performance against specialty standards. During negotiations, you might propose a "Margin-Share" model or a higher conversion factor that rewards the high-yield nature of your clinical activity. This moves the conversation away from standardized CMS rates and toward the actual revenue you generate.
Expect the administration to cite Fair Market Value (FMV) as a cap on your compensation. However, FMV is not a single number but a range. When you bring granular margin data to the table, you provide the legal team with the necessary documentation to justify placing your compensation at the top of that range. For a more detailed look at your specific standing, you can utilize a Specialty-Specific Revenue Analysis to validate your claims with objective evidence.
Identifying Your High-Margin Clinical Strengths
Strategic negotiation also involves clinical self-optimization. Not all wRVUs are created equal in terms of profitability. Some procedures may carry high work units but require expensive implants or long hospital stays that erode the margin. By analyzing which patient types or procedures generate the highest margin per hour, you can work with the system to shift your clinical mix toward more sustainable activities.
Learning how to calculate physician contribution margin allows you to identify these high-value activities with precision. This clarity enables you to advocate for a schedule that prioritizes these cases. It creates a scenario where the hospital sees increased profit and you secure the resources needed to maintain high-quality care without the burnout associated with the volume treadmill.
Navigating the Intersection of Clinical Effort and Economic Clarity
Achieving a fair market valuation in 2026 requires a sophisticated shift in perspective. While clinical effort remains the foundation of your practice, it's the economic clarity of your contribution that determines your professional leverage. A hybrid approach that balances contribution margin vs wRVU is now the gold standard for high-level negotiations. This dual-lens strategy ensures that your workload is accurately recorded while your actual revenue generation is fully recognized. By integrating these two metrics, you move beyond the limitations of volume-based production and enter a space of strategic professional advocacy.
The transition toward this hybrid model is driven by the reality of location-adjusted and specialty-specific nuances. A physician practicing in a high-cost urban center faces different economic pressures than one in a rural setting, yet wRVUs often treat their labor as identical. By incorporating margin data, you account for these external variables, providing a more honest reflection of your worth to the specific health system you serve. This level of granular accuracy is the only way to bypass the "new normal" of fragile operating margins and rising physician subsidies.
The Empwr Index: Your Unified Value Score
The Physician Economic Value Platform was developed to solve the transparency crisis in healthcare administration. It translates your raw clinical data into clear, actionable revenue estimates through the Empwr Index Report. This score acts as a bridge between your daily workload and your long-term wealth, giving you a single metric that resonates with both clinical directors and chief financial officers. By using this unified score, you can enter meetings with the quiet confidence that your claims are backed by rigorous methodology.
We utilize authoritative RAND and CMS data sources to bypass the "black box" accounting methods often used by hospital systems. This objective evidence allows you to see the hidden truths of your practice, such as how site-of-service differentials affect your bottom line. Having access to these data-backed insights provides the peace of mind necessary to navigate high-stakes contract discussions without the fear of being undervalued or overlooked.
Data-Backed Advocacy for the Modern Physician
Physicians are the best-positioned individuals to lead healthcare economic reform because they sit at the intersection of patient care and revenue generation. Taking control of your professional worth is the first step toward a more transparent and fair industry. Our platform allows you to monitor your valuation throughout the contract year, ensuring that your compensation remains aligned with your actual economic impact as market conditions shift.
By utilizing a Specialty-Specific Revenue Analysis, you can track how changes in payer mix or new clinical workflows influence your margin in real-time. This proactive approach transforms you from a passive participant in a compensation formula into an informed leader of your own professional strategy. We invite you to calculate your true value today and begin the conversation about your clinical impact with the clarity you deserve.
Mastering Your Economic Narrative in 2026
The transition from volume-based productivity to a focus on economic impact is the defining shift for the modern physician. You've seen how relying on work units alone obscures your true profitability and leaves you vulnerable to the productivity trap of diminishing returns. By mastering the distinction between contribution margin vs wRVU, you gain the clarity needed to align your clinical effort with your financial worth. This isn't just about a higher bonus; it's about securing the resources and respect your expertise deserves.
You don't have to navigate these complex systems alone. Our physician-led platform utilizes authoritative CMS and RAND data to provide you with the same specialty-specific and location-adjusted analytics used by health system C-suites. This objective evidence empowers you to lead informed conversations about your future with confidence and precision. Access the Empwr Index to see your true economic value today. You have the skills to provide exceptional care; it's time you had the data to prove what that care is truly worth.
Frequently Asked Questions
Is contribution margin a better metric than wRVU for physician compensation?
Contribution margin provides a more comprehensive view of economic value, while wRVUs focus strictly on clinical effort. Relying on a single metric often leads to an incomplete valuation of your professional impact. A balanced model using both metrics is the gold standard for 2026. This approach ensures your compensation reflects both the intensity of your labor and the actual profit you generate for the healthcare system.
How can I find my contribution margin if my hospital doesn’t provide it?
You can estimate your margin by aggregating your total collections and subtracting direct expenses like staff salaries and medical supplies. Since hospitals often treat this as a "black box" metric, utilizing a Physician Economic Value Platform is essential. By cross-referencing your wRVU output with authoritative RAND and CMS data, you can derive a reliable estimate of your true economic standing without relying on internal hospital reports.
Can a high wRVU producer have a low contribution margin?
Yes, a high volume of wRVUs doesn't automatically guarantee a strong contribution margin. If your practice involves high-cost implants, expensive specialized staff, or a payer mix heavily weighted toward public insurance, your direct variable costs might consume a large portion of your revenue. Understanding the interplay of contribution margin vs wRVU helps identify if your high productivity is actually translating into bottom-line profitability for the organization.
What is a typical physician contribution margin percentage?
Typical percentages vary significantly by specialty and regional market conditions. For example, surgical specialties often maintain higher margins due to high reimbursement rates relative to their variable costs. While median hospital operating margins were approximately 1.9% in February 2026, individual physician margins must be significantly higher to cover the system's fixed overhead. Your specific percentage depends on your local payer contracts and operational efficiency.
Does contribution margin include downstream revenue like labs and imaging?
Traditional contribution margin calculations focus on the direct revenue and variable costs of your specific professional services. While downstream revenue from labs and imaging is a critical part of your total economic impact, it's usually tracked as a separate "keepage" metric. Proving your value in 2026 requires demonstrating both a healthy direct margin and your role as a central hub for the hospital’s ancillary service lines.
How does the RAND pricing data affect my contribution margin calculation?
RAND pricing data is a vital tool for translating Medicare-based units into real-world commercial revenue. It provides the ratios necessary to estimate what private payers actually pay relative to the 2026 Medicare conversion factor of $33.40. By applying these specialty-specific and location-adjusted benchmarks, you can more accurately quantify the "revenue-effort gap" that standard wRVU models often ignore during contract negotiations.
Can I negotiate a contract based purely on contribution margin?
Negotiating a contract based strictly on margin is uncommon in large systems, but it's becoming a powerful tool for justifying a higher wRVU conversion factor. Most administrators prefer the simplicity of wRVUs for baseline pay while using margin data to approve bonuses or resource requests. Presenting a clear analysis of contribution margin vs wRVU allows you to position yourself as a strategic partner rather than just a production unit.
What happens to my contribution margin if I switch from a hospital to a private practice?
Switching to private practice typically shifts your economic profile from a subsidy-based model to one of direct ownership. In a private setting, your contribution margin effectively becomes your take-home pay after all practice expenses are met. While you lose the safety net of a hospital salary, you gain the ability to capture the full economic value of your services, including facility fees and ancillary revenue that hospitals typically retain.