

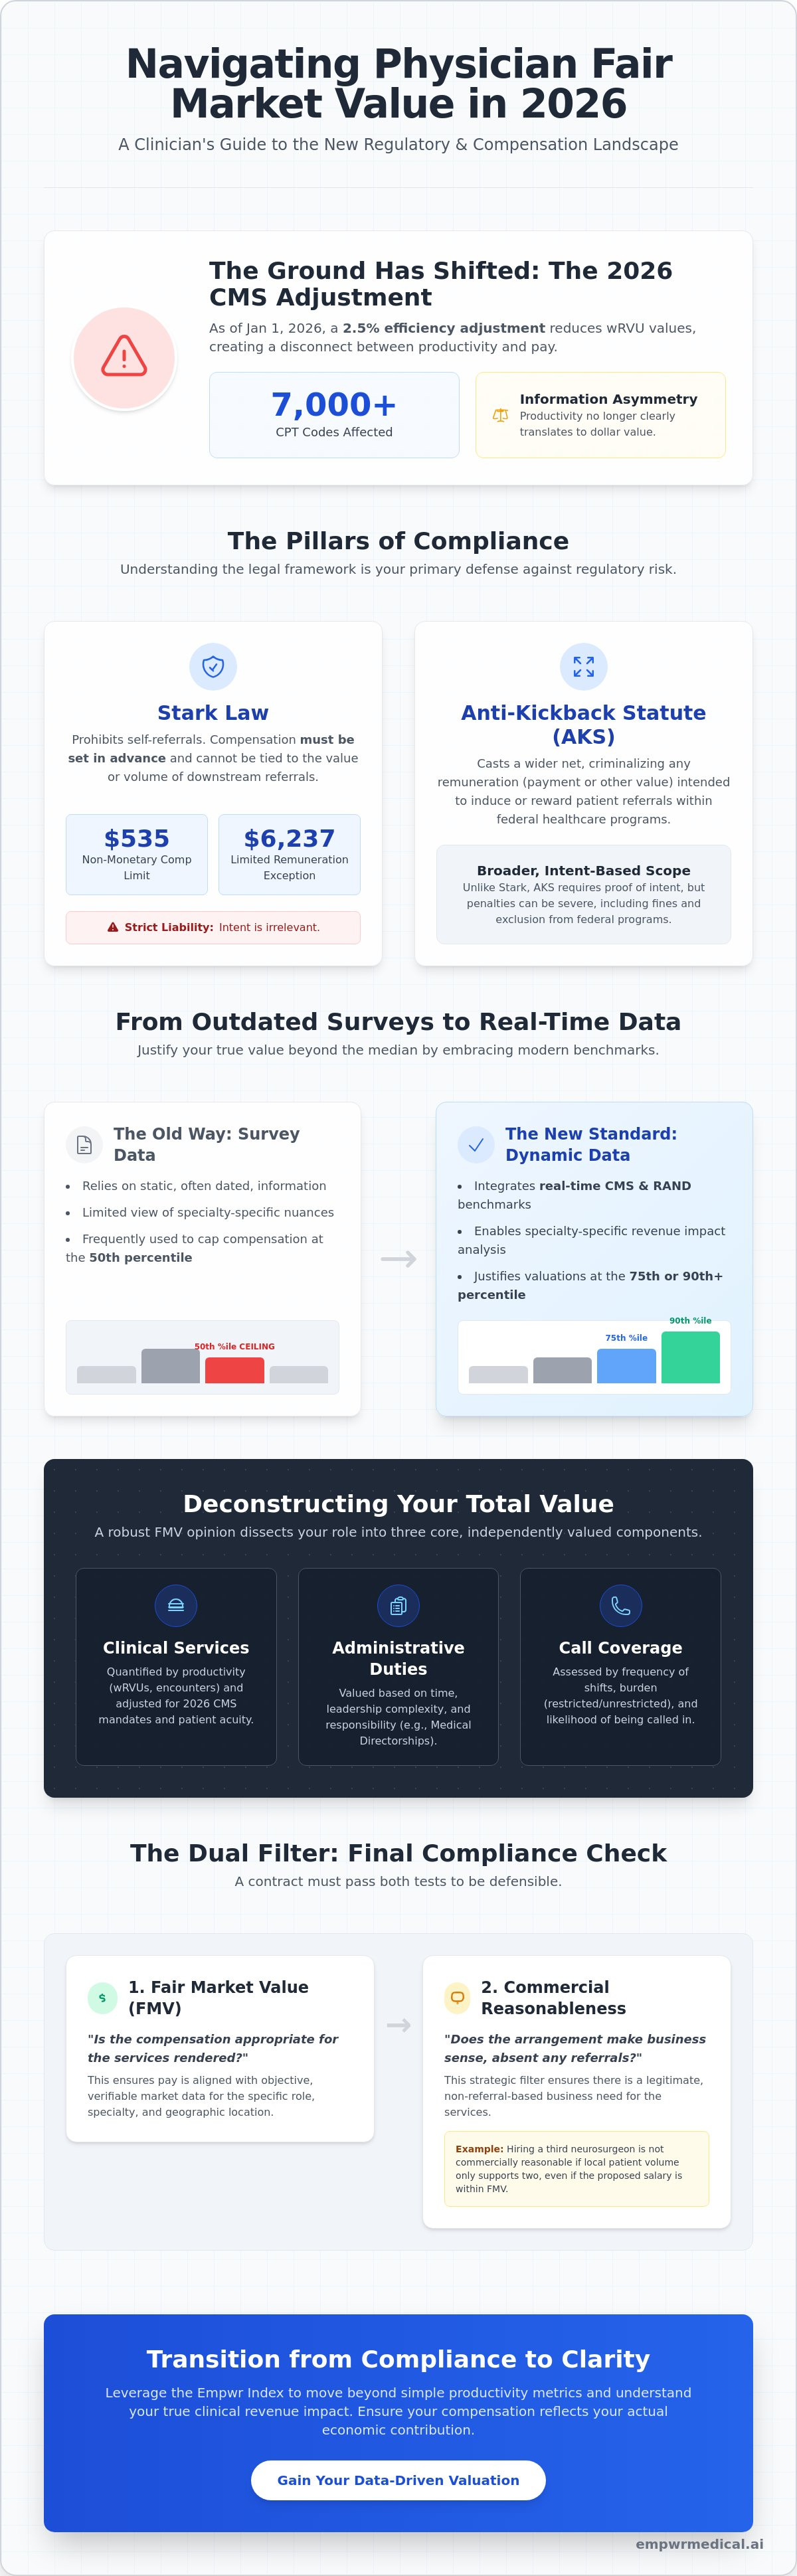
As of January 1, 2026, the CMS 2.5% efficiency adjustment has reduced work relative value units for over 7,000 CPT codes, fundamentally shifting the ground beneath your compensation model. This shift often leaves high-performing clinicians facing a frustrating information asymmetry where productivity doesn't clearly translate to dollar value. Accessing precise physician fair market value data is no longer just a matter of curiosity; it's a regulatory necessity in an environment where the Stark Law non-monetary compensation limit has climbed to $535 and the limited remuneration exception reached $6,237.
It's understandable to feel anxiety regarding commercial reasonableness or the opaque nature of hospital valuation methods. This guide empowers you to master the regulatory frameworks and authoritative data sources that define your professional worth and economic impact. We will provide a structured framework for proving your clinical value, moving beyond standard surveys to include specialty-specific revenue analysis. You'll gain the clarity needed for informed conversations, ensuring your compensation reflects both your technical rigor and the operational reality of the 2026 healthcare market.
Key Takeaways
- Understand the fundamental shift in regulatory compliance that requires compensation to remain independent of the value of downstream referrals.
- Navigate the limitations of traditional surveys by integrating real-time physician fair market value data from CMS and RAND pricing benchmarks.
- Identify the specific boundaries set by the Stark Law and Anti-Kickback Statute to ensure your contract remains commercially reasonable in a shifting market.
- Transition from productivity-based metrics to a comprehensive understanding of your clinical revenue impact through the Empwr Index.
- Leverage specialty-specific benchmarks to move beyond the median and justify valuations that reflect your actual economic contribution.
Defining Physician Fair Market Value in the Modern Regulatory Era
In the current regulatory landscape, fair market value (FMV) represents the compensation level that would be achieved through an arm's-length transaction between well-informed, unrelated parties who aren't under any compulsion to transact. It's a standard rooted in transparency and objective evidence. For clinicians, physician fair market value data serves as the baseline for these negotiations, ensuring that pay remains commensurate with the actual work performed rather than the business generated for a health system. It acts as a protective boundary, grounding professional worth in verifiable economic reality.
A critical distinction in 2026 is the absolute exclusion of downstream referral value. Under the Stark Law, compensation must be set in advance and cannot fluctuate based on the volume or value of referrals for designated health services. This is a strict liability statute, meaning intent is irrelevant. With the 2026 non-monetary compensation limit set at $535 and the limited remuneration exception at $6,237, the boundaries for incidental benefits are tighter than ever. Your worth is calculated based on your direct clinical output, administrative expertise, and the burden of your call schedule. As the 2026 CMS efficiency adjustment reduces wRVU values for thousands of codes, understanding how your specific specialty benchmarks against these changes is essential for maintaining a defensible contract.
FMV isn't a static point on a graph; it's a range. While many administrators point to the 50th percentile as a ceiling, the reality is that the 75th or 90th percentiles are often justifiable when backed by superior quality metrics or high-acuity patient loads. The modern era has moved beyond pure volume. 2026 standards increasingly integrate quality-of-care benchmarks and patient outcome data into the valuation process, allowing for a more nuanced representation of a physician's true economic impact.
The Core Components of an FMV Opinion
An FMV opinion typically dissects your role into three distinct buckets. Clinical services are quantified through productivity metrics like wRVUs or patient encounters, adjusted for the 2026 CMS efficiency mandates. Administrative duties, such as medical directorships, are valued based on the time commitment and the complexity of leadership required. Finally, call coverage is assessed by the frequency of shifts and the likelihood of being called into the facility. Each component requires its own subset of physician fair market value data to ensure the total package remains compliant and reflects the specific demands of your specialty.
Commercial Reasonableness vs. Fair Market Value
A contract can fall within a compliant FMV range but still fail the commercial reasonableness test. This filter asks a simple question: does the arrangement make sense for the business even if no referrals exist? For example, hiring a third neurosurgeon might be FMV in terms of salary, but if the local patient volume only supports two, the third contract may not be commercially reasonable. Hospitals use these dual filters to mitigate risk. You should use them to frame your clinical revenue impact, proving that your presence is a strategic necessity regardless of the referral stream.
The Pillars of FMV: Stark Law and Anti-Kickback Statutes
The integrity of a physician contract rests on its adherence to federal fraud and abuse laws. These regulations ensure that clinical decisions remain untainted by financial incentives. While the Stark Law focuses specifically on prohibiting self-referrals for designated health services, the Anti-Kickback Statute (AKS) casts a wider net by criminalizing any remuneration intended to induce patient referrals within federal programs. In 2026, the stakes are higher. The Stark Law remains a strict liability statute. This means you can be found in violation even if you didn't intend to break the law.
Precise physician fair market value data is the primary defense against these legal risks. For the 2026 calendar year, the aggregate limit for non-monetary compensation has increased to $535. Additionally, the limit for the limited remuneration exception is now $6,237. These aren't just arbitrary numbers; they are strict boundaries. Safe Harbors provide a path of protection for arrangements that meet specific criteria, such as being in writing, set in advance, and consistent with FMV. If an arrangement fits a Safe Harbor, it's immune from prosecution under the AKS, making these standards the bedrock of any secure contract.
Why Compliance Matters to the Individual Physician
Liability isn't just an institutional concern. It's personal. The government evaluates whether a physician knew or should have known that an arrangement violated standards. Compliance departments often use physician fair market value data to set a hard cap on salary offers to mitigate this risk. However, you can use this same data to your advantage. By understanding the methodology behind these caps, you can shift the conversation from what the hospital can pay to what the data justifies. Exploring a specialty-specific revenue analysis can help you frame your request within these safe boundaries.
Common Regulatory Red Flags in Contracts
Contractual structures that fluctuate based on the volume or value of referrals are immediate red flags. This includes any bonus structure that indirectly rewards you for the laboratory tests or imaging you order. Another concern involves ghost administrative hours, which are payments for leadership roles where the actual work isn't documented or performed. Finally, total remuneration reaching or exceeding the 90th percentile requires rigorous clinical justification. Without specific data proving high-acuity caseloads or unique expertise, these high-end payments invite intense regulatory scrutiny.
Traditional Benchmarks vs. Clinical Reality: The Limits of Surveys
Traditional surveys from MGMA, AMGA, and SullivanCotter have long been treated as the definitive source for physician fair market value data. These organizations aggregate compensation figures from thousands of healthcare systems, providing a statistical snapshot of the market. However, relying solely on these benchmarks can be misleading. A fundamental consideration in healthcare compliance is that FMV must reflect current market conditions, yet most surveys suffer from a significant "lag effect." Data published in 2026 typically reflects physician performance and salary levels from 2024 and 2025. This means the 2.5% CMS efficiency adjustment implemented in early 2026 won't be visible in these reports for years, leaving you with a distorted view of the current landscape.
Sample size limitations further complicate the picture, especially for niche sub-specialties. When only a handful of physicians in a specific region report their data, the resulting median is easily skewed by outliers. Hospitals often operate in "survey silos," cherry-picking the specific percentiles or data sets that align with their internal budgets rather than the clinician's actual market worth. This creates an information gap where the physician is at a distinct disadvantage during negotiations. You can't rely on a single data point to tell your entire story.
The wRVU Misconception
Work Relative Value Units (wRVUs) are the industry's favorite metric for measuring productivity, but they don't capture your full economic contribution. There's often a vast gap between the work effort you exert and the actual revenue the hospital collects. wRVU conversion factors vary significantly by region and payer mix because local market demand and reimbursement rates dictate the actual dollar value of a physician's work effort. If your contract relies strictly on a static conversion factor from a two-year-old survey, you're likely ignoring the contribution margin you provide to the facility.
Survey Data vs. Real-Time Market Trends
Identifying "stale" data is crucial for a fair negotiation. Market distortions caused by private equity acquisitions have further decoupled survey medians from the clinical reality on the ground. These corporate entities often offer higher base salaries that aren't yet reflected in traditional benchmarks, effectively raising the floor for everyone else. Instead of settling for lagging indicators, you should prove your value as a physician by using a broader array of physician fair market value data that accounts for real-time reimbursement trends and your specific clinical revenue impact.
Beyond the Median: Using CMS and RAND Data for Accurate Valuations
While surveys offer a backward-looking view, utilizing public physician fair market value data from the Centers for Medicare & Medicaid Services (CMS) provides a real-time window into actual reimbursement rates. CMS fee schedules are the most transparent and objective source for determining what payers actually distribute for clinical services. Unlike private surveys that rely on self-reported compensation, CMS data is based on the Physician Fee Schedule (PFS), which is updated annually to reflect shifts in the economic environment. This level of transparency is vital for clinicians who need to ground their professional worth in verifiable clinical revenue rather than institutional averages.
Achieving granular accuracy requires looking at location-specific adjustments. The Geographic Practice Cost Index (GPCI) allows you to adjust national benchmarks based on the specific costs of operating in your region. This ensures that your valuation isn't skewed by data from low-cost rural areas or high-cost metropolitan hubs that don't reflect your reality. By combining these geographic indices with RAND pricing data for physicians, you can see how commercial insurance rates in your specific market compare to Medicare. This comparison is essential for identifying the "commercial uplift" that private payers provide, which is often missing from standard hospital-provided data sets.
Mastering the CMS Data Set
To use this data effectively, you must identify the current conversion factors for your most frequent CPT codes. Site-of-service differentials also play a massive role; a procedure performed in a hospital-based department often carries a different valuation than one performed in a private office. Understanding these nuances allows you to quantify your direct impact on the facility's bottom line. When you can show exactly how your clinical workload translates into revenue using public benchmarks, you eliminate the information asymmetry that often plagues contract discussions. For a deeper look at your specific numbers, a Specialty-Specific Revenue Analysis can bridge the gap between public data and your personal productivity.
The Power of Contribution Margin Analysis
Administrators are often more persuaded by contribution margin than by survey percentiles. This metric is defined as your total generated revenue minus the direct clinical costs associated with your practice. It represents the actual profit you bring to the organization before indirect overhead is applied. Proving your contribution margin allows you to advocate for a compensation model that reflects your true economic footprint. This methodology translates abstract percentiles into a concrete economic footprint, grounded in the most current physician fair market value data available. It moves the conversation from a defensive posture about compliance to a strategic discussion about your clinical value.
From Compliance to Clarity: Leveraging the Empwr Index
True professional empowerment requires moving beyond the passive consumption of institutional data. While CMS and RAND provide the raw materials, the Empwr Index synthesizes this physician fair market value data into a multi-factor analysis that accounts for specialty-specific workflows and regional economic variations. This methodology represents a shift in perspective. Instead of asking what the market pays, you're quantifying your specific clinical revenue impact. This clarity transforms the negotiation from a professional request into a data-driven demonstration of value. It allows you to lead informed conversations with leadership that are grounded in the steady assurance of methodology rather than emotional appeals.
Accuracy in valuation isn't possible without considering the unique operational realities of your specialty. A surgeon's economic footprint differs fundamentally from that of a primary care physician or a hospitalist. The Empwr platform interprets these nuances, translating complex backend billing data and payer mix variables into simplified, actionable results. By focusing on your specialty-specific revenue analysis, you gain a transparent view of the hidden truths within your contract. You're no longer just a line item in a hospital budget; you're a strategic partner with a clear understanding of your economic contribution.
Building Your Data-Backed Negotiation Strategy
Success at the bargaining table depends on your ability to synthesize traditional survey benchmarks with real-time reimbursement trends. Don't walk into a meeting with a single percentile from a lagging report. Instead, create a defensible roadmap for your contract renewal. This involves building a 'defensibility binder' that includes your productivity metrics, quality scores, and the regional GPCI adjustments discussed earlier. Using the Physician Economic Value Platform, you can monitor these variables throughout the year. This proactive approach ensures that when the time comes for renewal, your position is rooted in a rigorous synthesis of physician fair market value data that compliance departments cannot easily dismiss.
The Future of Physician Valuation
The power balance in healthcare is shifting as transparency in pricing becomes the new standard. In 2026, data-driven advocacy is the only way to maintain professional autonomy amidst increasing corporate consolidation. When you understand the mechanics of how your value is derived, you reduce the cognitive load of complex negotiations. You gain the quiet confidence that comes from objective evidence. This is the bridge between dense institutional data and your personal professional strategy. It's time to stop guessing and start quantifying. You can calculate your true economic value with the Empwr Index to ensure your compensation reflects the reality of your clinical impact.
Securing Your Professional Worth with Data-Driven Clarity
The transition from productivity-based metrics to a comprehensive understanding of clinical revenue impact is essential for the modern physician. You've seen how the 2026 CMS efficiency adjustments and the "lag effect" of traditional surveys can obscure your true economic footprint. Relying on outdated or incomplete physician fair market value data leaves you at a disadvantage during critical contract discussions. By integrating real-time CMS and RAND benchmarks with specialty-specific economic modeling, you can replace information asymmetry with objective evidence.
Empwr Medical acts as a bridge between dense institutional data and your personal professional strategy. As a physician-founded organization, we focus on translating complex financial systems into actionable insights that respect your intelligence and professional standing. It's time to lead your next negotiation with the quiet confidence that only rigorous data can provide. Get your personalized Empwr Index Report today and secure a compensation model that reflects your actual contribution to the healthcare system. You deserve a partner that brings hidden truths to light.
Frequently Asked Questions
What is the most accurate source for physician fair market value data?
The most accurate physician fair market value data isn't found in a single survey, but in a synthesis of multiple authoritative sources. While traditional benchmarks from MGMA or AMGA provide historical context, integrating real-time CMS fee schedules and RAND pricing data ensures your valuation reflects current reimbursement realities. This multi-factor approach reduces the risk of relying on lagging indicators that don't account for recent regulatory shifts or local market nuances.
Can a hospital pay a physician more than the 90th percentile of survey data?
Hospitals can pay above the 90th percentile, provided the arrangement is supported by exceptional clinical circumstances. This level of compensation requires rigorous documentation of high-acuity caseloads, unique sub-specialty expertise, or superior quality outcomes. While high percentiles aren't a per se violation of the Stark Law, they invite intense regulatory scrutiny. You must ensure that the total economic contribution justifies the premium payment within a commercially reasonable framework.
How often should physician fair market value assessments be updated?
Assessments should be updated annually or whenever a material change occurs in the physician's role or the regulatory environment. For 2026, the CMS efficiency adjustments and new Stark Law limits, such as the $535 non-monetary compensation cap, make frequent reviews essential. Regular updates ensure that your contract remains compliant with federal fraud and abuse laws while reflecting the most current market trends and clinical reimbursement rates.
What is the difference between FMV and commercial reasonableness in 2026?
Fair market value represents the dollar amount consistent with an arm's-length transaction, whereas commercial reasonableness assesses the business logic of the arrangement. In 2026, a contract might fall within a compliant FMV range but still be considered unreasonable if the facility doesn't actually need the service. Both filters must be cleared to ensure the arrangement makes sense even if no patient referrals are ever generated between the parties.
How do wRVUs impact my fair market value calculation?
wRVUs serve as the primary metric for quantifying clinical productivity, but their impact on FMV depends on the conversion factor used. The 2026 CMS efficiency adjustment reduced wRVU values for over 7,000 CPT codes, fundamentally changing how work effort translates into dollar value. Accurate physician fair market value data must account for these shifts to ensure that productivity-based compensation models remain defensible and reflective of actual clinical revenue.
Does the location of my practice affect the fair market value data?
Location significantly influences valuation through the Geographic Practice Cost Index (GPCI). This index adjusts national benchmarks to account for regional variations in operating costs, including labor, rent, and malpractice premiums. A physician in a high-cost metropolitan area will have a different FMV profile than one in a rural setting. Granular accuracy requires using location-adjusted data to ensure your compensation reflects the economic reality of your specific practice environment.
What happens if a physician's compensation is found to be above FMV?
Compensation found to be above FMV can trigger severe penalties under the Stark Law and Anti-Kickback Statute. As the Stark Law is a strict liability statute, the government doesn't need to prove intent to issue fines or exclude a provider from federal programs. Violations often result in the requirement to refund all reimbursements received during the non-compliant period, which can lead to catastrophic financial losses for both the physician and the health system.
How can I use RAND pricing data to negotiate a better contract?
RAND pricing data allows you to quantify the commercial uplift by comparing private insurance rates to Medicare benchmarks in your region. You can use this data to prove that your clinical revenue impact is higher than what Medicare-only models suggest. This evidence provides a powerful leverage point during negotiations, allowing you to advocate for a compensation package that reflects the actual reimbursement levels you generate from a diverse payer mix.