

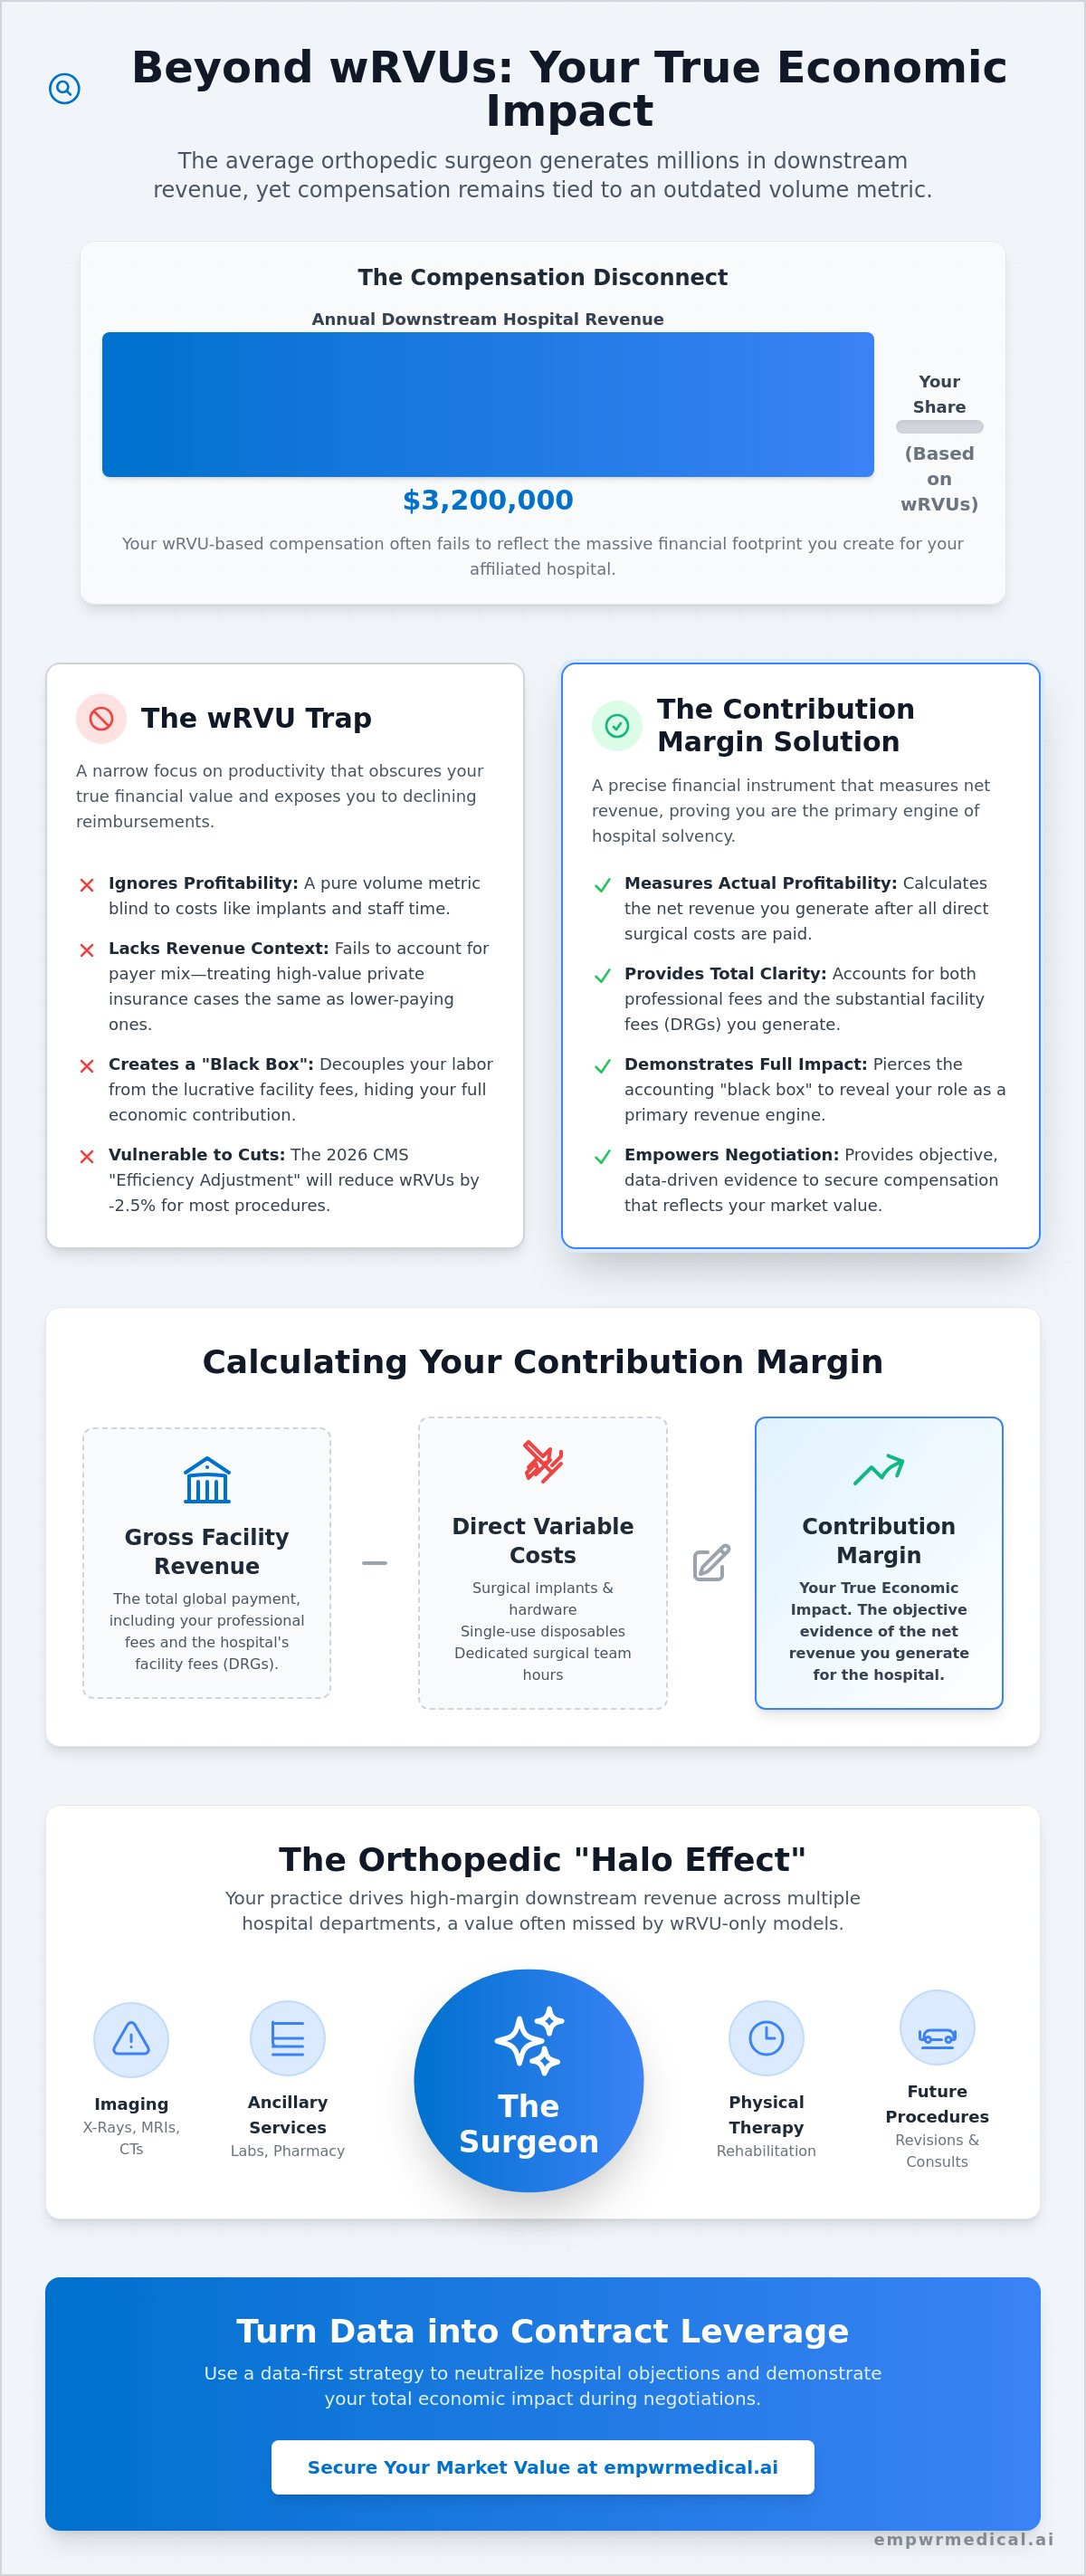
Did you know the average orthopedic surgeon generates $3.2 million in annual downstream revenue for their affiliated hospital, yet most are still compensated based on a narrow wRVU metric that ignores this massive financial footprint? It's a frustrating reality where your compensation often fails to reflect the actual revenue you generate. You likely feel the weight of this disconnect, especially as rising overhead and the 2026 efficiency adjustment of -2.5% on work RVUs continue to erode your orthopedic surgeon contribution margin and your perceived economic value.
We understand that you're more than a productivity factory; you're the primary engine of hospital solvency. This guide will show you how to calculate and leverage your true financial impact to move beyond wRVUs and secure your market value in contract negotiations. We'll break down the mechanics of downstream revenue, the impact of the 2026 CMS conversion factor of $33.42, and how tools like our Specialty-Specific Revenue Analysis provide the clarity you need to lead informed conversations with hospital leadership.
Key Takeaways
- Understand why wRVUs are a volume metric that fails to capture your actual profitability and why shifting to a margin-based perspective is essential for modern contract discussions.
- Learn the precise formula for calculating the orthopedic surgeon contribution margin by identifying gross facility revenue and subtracting direct variable costs like implants and staff time.
- Quantify the "Halo Effect" of your practice, including the high-margin downstream revenue generated through imaging, physical therapy, and ancillary services.
- Discover how to use RAND pricing data and private payer benchmarks to demonstrate your value relative to CMS rates during negotiation.
- Adopt a data-first strategy to neutralize hospital objections regarding facility losses by presenting objective evidence of your total economic impact.
The wRVU Trap: Why Orthopedic Surgeons Must Look at Contribution Margin
For decades, hospital administrators have used the Work Relative Value Unit (wRVU) as the primary yardstick for surgical productivity. While this system provides a standardized way to measure physician effort, it fails to capture the fiscal reality of a modern surgical practice. The contribution margin serves as a much more precise instrument; it represents the net revenue generated by your services minus the direct variable costs associated with providing them. By focusing exclusively on wRVUs, surgeons often overlook their true economic impact, falling into a trap where higher productivity doesn't necessarily translate to higher institutional value. This is especially critical given the 2026 CMS "Efficiency Adjustment," which imposes a -2.5% reduction in work RVUs for most non-time-based surgical procedures, further devaluing your labor in a volume-only model.
Contribution Margin vs. wRVU: A Structural Comparison
The fundamental flaw in the wRVU model is its indifference to cost and revenue quality. Consider two surgeons who both produce 10,000 wRVUs annually. Surgeon A utilizes premium, high-cost implants for every joint replacement, while Surgeon B uses more cost-effective options with similar clinical outcomes. Under a standard compensation plan, their pay might be identical. However, their orthopedic surgeon contribution margin is vastly different. The wRVU ignores the price of surgical disposables, specialized staff time, and the specific payer mix of the patient population. A surgeon with a high volume of private insurance cases generates significantly more facility fee revenue than one primarily seeing CMS patients, yet the wRVU remains a static, blind metric that ignores these variables.
Why Hospitals Prefer the wRVU Model
Hospital systems often prefer the wRVU model because it effectively decouples the surgeon's labor from the lucrative facility fees they generate. By keeping surgeons focused on a productivity silo, administrators can maintain a "black box" around hospital accounting. This lack of transparency makes it difficult for you to argue for a share of the downstream revenue you create. Our Physician Economic Value Platform is designed to pierce this veil. We provide the Specialty-Specific Revenue Analysis that hospitals often prefer you don't see. This data allows you to move beyond the narrow wRVU lens and view your practice through the holistic framework of Physician Economic Value. It's about moving from being viewed as a cost center to being recognized as a primary revenue engine for the entire facility.
Calculating the Orthopedic Surgeon Contribution Margin Formula
Quantifying your economic impact requires a shift from productivity units to fiscal accounting. To calculate the orthopedic surgeon contribution margin, you must first aggregate all revenue streams tied to your surgical interventions. This includes both your professional fees and the substantial facility fees associated with Diagnosis-Related Groups (DRGs). While the wRVU problem keeps many surgeons focused on a small fraction of the pie, the true margin accounts for the total global payment.
Once gross revenue is identified, you must subtract direct variable costs. These are expenses that only exist because the surgery occurred. Key variables include:
- Surgical implants and hardware.
- Single-use disposables and sterile processing.
- Dedicated surgical team hours.
Exclude fixed costs like hospital administration, rent, or general non-surgical overhead. These expenses persist regardless of your case volume. Finally, incorporate geographic adjustments using CMS GPCI data to account for regional labor and cost variations. This ensures your data reflects the specific economic reality of your market.
The Role of DRGs and Facility Fees
DRGs determine the global payment the hospital receives for an episode of care. This payment is divided into the professional fee and the technical component. In most orthopedic procedures, the facility fees often dwarf professional fees by a significant margin. This technical component is designed to cover the high overhead of the operating suite and inpatient stay. As CMS implements a -7% payment decrease for facility-based services in 2026, understanding how these DRGs are structured becomes vital for protecting your compensation.
Managing Variable Costs: The Implant Factor
Implants are the largest variable cost in most orthopedic procedures. You influence this margin through your choice of vendors and the standardization of Physician Preference Items (PPI). By selecting cost-effective hardware that maintains clinical excellence, you directly improve the orthopedic surgeon contribution margin of every case. Our Physician Economic Value Platform tracks these variables, translating your clinical choices into clear financial data. The Empwr Index Report specifically accounts for these variables, allowing you to demonstrate that you're managing resources effectively. This transparency provides a powerful lever during contract renewals.
The Orthopedic Halo Effect: Quantifying Downstream Revenue
The financial impact of an orthopedic surgeon is often compared to an iceberg; the professional fee is merely the visible tip. Beneath the surface lies the "halo effect," or downstream revenue, which encompasses every medical service triggered by the initial surgical consultation. While administrators focus on the operating room, they frequently ignore the lucrative ecosystem that surrounds it. According to 2026 data, the average orthopedic surgeon generates $3.2 million in annual downstream revenue for their affiliated hospital. This includes high-margin diagnostic imaging like MRI, CT, and X-ray, as well as laboratory services and anesthesia fees that are inextricably linked to every surgical case.
Physical therapy (PT) represents another critical pillar of this economic value. Hospital-owned PT departments often rely on surgical referrals to maintain high utilization rates and consistent profitability. When you perform a total joint replacement, you aren't just generating a single DRG payment. You're initiating a multi-month revenue stream of rehabilitation and follow-up care. An objective analysis of orthopedic surgery profitability reveals that these ancillary services often carry higher margins than the surgery itself. Failing to include these figures in your orthopedic surgeon contribution margin calculation leads to a significant undervaluation of your role within the healthcare system.
Ambulatory Surgery Centers (ASCs) and Margin Shifts
The accelerating migration of procedures to Ambulatory Surgery Centers (ASCs) is fundamentally altering the margin landscape. Driven by the 2026 facility-based payment decrease of -7%, many surgeons are evaluating the economic impact of moving cases out of the hospital. In an ASC setting, the contribution margin often improves due to lower overhead and more efficient staffing models. Surgeons should use the following checklist to evaluate their ASC economic impact:
- Compare the technical component reimbursement of your top five CPT codes across both settings.
- Analyze the "turnover time" efficiency and its impact on daily case volume.
- Evaluate the cost-savings of ASC-specific supply chain contracts.
Capturing the "Lifetime Value" of an Orthopedic Patient
A surgeon's value extends far beyond the operating room and the immediate post-operative period. We must view patient care through the lens of lifetime value. A single successful intervention often establishes a long-term relationship, leading to future procedures, family referrals, and years of ancillary revenue. During contract negotiations, presenting this "referral value" as part of your Physician Economic Value Platform is essential. It transforms the conversation from a debate over wRVU rates into a strategic discussion about your role as a primary driver of institutional growth. By using our Specialty-Specific Revenue Analysis, you can quantify these "hidden" streams and ensure your contract reflects the total revenue you command.
Benchmarking Your Value: CMS Data vs. Private Payer Realities
Hospital administrators often point to declining Medicare reimbursement as a justification for stagnant compensation. While the 2026 Medicare Physician Fee Schedule does project a -5% overall impact on orthopedic reimbursement, this represents only a fraction of the total economic picture. To understand your true orthopedic surgeon contribution margin, you must look beyond CMS and analyze private payer premiums. RAND Corporation data frequently indicates that private insurers pay between 200% and 300% of Medicare rates for the same procedures. This discrepancy is where the hospital's real profit resides, yet it is rarely discussed during standard contract reviews.
Using RAND Data to Identify Underpayment
Most surgeons rely on MGMA or similar surveys to gauge their worth. These benchmarks are inherently flawed because they rely on self-reported data that can be easily manipulated or skewed by sample size. The "RAND Benchmark" offers a more rigorous alternative by analyzing actual claims data to reveal what private insurers pay for hospital services. If your department is being told it's "losing money" based on Medicare rates, RAND data can prove that your private payer mix makes you significantly more profitable than the hospital claims. It provides an objective counter-narrative to the "black box" accounting often used to suppress physician pay.
Geographic Adjustments and Fair Market Value
Geographic location is a critical variable that many national benchmarks fail to address adequately. A median salary of $795,000 might look impressive on a national scale, but it carries little weight in high-cost-of-living markets where operational expenses are elevated. We utilize the CMS Geographic Practice Cost Index (GPCI) to adjust for regional variations in labor, rent, and malpractice insurance. A national average is irrelevant to your specific market reality. The "Empwr Index" approach integrates these location-adjusted revenue estimates to provide a granular view of your economic standing.
Accuracy in valuation requires merging these disparate data sources into a single, actionable report. By contrasting CMS GPCI adjustments with private payer premiums, we create a transparent model of your institutional value. If you're ready to see how your specific practice compares to these benchmarks, you can access your Specialty-Specific Revenue Analysis today. This data-driven approach ensures that your Fair Market Value (FMV) is based on reality, not just the hospital's internal budget projections.
Strategic Negotiation: Turning Margin Data into Contract Leverage
Negotiation is an exercise in information asymmetry. When you enter a contract discussion armed only with your wRVU production, you're playing a game where the hospital holds all the cards. Shifting to a data-first approach requires you to present your orthopedic surgeon contribution margin as the centerpiece of your value proposition. This methodology forces a transition from a subjective debate about "market rates" to an objective analysis of your institutional impact. If an administrator claims the hospital is losing money on your service line, your margin data serves as the immediate rebuttal. It demonstrates that while the professional fee might be thin, the facility fees and technical components you command are keeping the department solvent.
Structuring your compensation around value-based bonus tiers allows you to share in the efficiencies you create. Instead of chasing more volume, you can negotiate incentives based on margin improvement, such as reducing implant costs or optimizing site-of-service shifts. This positions you as a strategic partner who's invested in the financial health of the system, rather than just an employee focused on a productivity treadmill. It changes the power dynamic from asking for a raise to presenting a business case for a fair share of the revenue you generate.
The 5-Step Negotiation Framework Using Empwr Reports
A structured approach ensures that you remain focused on objective data rather than emotional appeals. Follow these steps to build your case:
- Step 1: Request your internal hospital data, specifically your case-specific facility fees and variable costs. If they refuse to provide this transparency, it's a clear signal that they're relying on information asymmetry to suppress your value.
- Step 2: Generate an independent Empwr Index report. This provides an objective comparison using GPCI-adjusted data and private payer benchmarks.
- Step 3: Identify the "Value Gap." This is the difference between your current compensation and the revenue you contribute to the system's bottom line.
- Step 4: Present the "Halo Effect" data. Use the $3.2 million average downstream revenue figure to demonstrate your total system impact beyond the operating room.
- Step 5: Propose a contract structure that aligns your incentives with the orthopedic surgeon contribution margin you produce.
Common Negotiation Pitfalls for Orthopedic Surgeons
The most dangerous mistake a surgeon can make is accepting a "market average" salary without seeing the underlying data. These averages often include low-margin providers or data from regions with lower cost-of-living adjustments. Focusing only on the base salary is another strategic error; it ignores the potential for production bonuses and the long-term value of your ancillary referrals. We encourage you to seek "Informed Conversations" through the tools provided by our Physician Economic Value Platform. Clarity is your best defense against predatory contracting. To begin your journey toward a fair valuation, Generate your Empwr Index report today and take control of your professional future.
Secure Your Financial Future Through Data Clarity
The transition from a volume-based wRVU model to a value-based economic framework is no longer optional. By accurately identifying your orthopedic surgeon contribution margin, you move beyond the limitations of productivity silos and reveal your true institutional impact. We've explored how facility fees, downstream revenue, and private payer premiums constitute the majority of your economic footprint; failing to account for these variables leaves significant value on the table during contract discussions.
Empwr Medical provides the tools necessary to bridge the information gap between you and hospital administration. Our platform, designed by physicians for physician advocacy, utilizes authoritative CMS and RAND data to deliver location-adjusted and specialty-specific accuracy. You deserve a compensation structure that reflects the objective reality of the revenue you command. It's time to lead your next negotiation with the quiet confidence that only rigorous data can provide.
Calculate your true economic value with the Empwr Index and take the first step toward a more transparent and equitable professional partnership. You have the expertise; now you have the evidence to back it up.
Frequently Asked Questions
What is the average contribution margin for an orthopedic surgeon?
The average orthopedic surgeon contribution margin isn't a static national figure; it's a dynamic calculation of the net revenue remaining after variable expenses like implants are subtracted from the global payment. This margin varies significantly based on your sub-specialty and payer mix. Rather than relying on broad averages, it's more effective to analyze your specific case data to understand how much profit you're generating for the facility per procedure.
How does contribution margin differ from net profit in a medical practice?
Contribution margin differs from net profit by focusing exclusively on the variable costs associated with a specific procedure. While net profit subtracts every expense, including fixed overhead like rent and administrative salaries, the margin only accounts for costs like implants and surgical supplies. This distinction is vital because it shows the hospital how much each additional case you perform contributes to their ability to cover fixed institutional costs.
Can I calculate my contribution margin if the hospital won’t share their data?
You can generate a highly accurate estimate of your margin without internal hospital cooperation by utilizing our Physician Economic Value Platform. We use location-adjusted claims data and RAND benchmarks to reconstruct the facility revenue and variable costs typical for your specialty and region. This independent analysis provides the clarity needed to challenge "black box" accounting during your next contract review.
Why should I care about facility fees if I only get paid professional fees?
You should care about facility fees because they represent the largest portion of the economic value you generate for the healthcare system. Even if your contract is strictly professional fee-based, the hospital's ability to pay you is derived from the total global payment. Demonstrating that your cases yield high facility margins provides the data-backed leverage required to secure a compensation package that reflects your true market worth.
How does the Empwr Index differ from MGMA or SullivanCotter data?
The Empwr Index differs from MGMA and SullivanCotter by moving beyond self-reported salary surveys to utilize objective, third-party claims data. While traditional surveys provide a broad look at what other surgeons are paid, our Specialty-Specific Revenue Analysis focuses on what you actually generate. It incorporates RAND pricing data to account for the premium private payers often pay over CMS rates.
Is downstream revenue legally allowed to be included in my compensation model?
While Stark Law and Anti-Kickback Statutes prohibit direct payment for the volume or value of referrals, downstream revenue is a legitimate factor in determining Fair Market Value (FMV). it's legally permissible to use this data to justify a higher base salary or a more competitive recruitment package. Quantifying this impact proves you're a primary driver of system solvency rather than just a productivity factory.
How often should an orthopedic surgeon review their contribution margin data?
Surgeons should review their orthopedic surgeon contribution margin data annually at a minimum, or six months prior to a contract expiration. Frequent reviews are especially important given the 2026 CMS "Efficiency Adjustment" and the -7% payment decrease for facility-based services. Staying current with these shifts ensures you aren't blindsided by hospital administrators using outdated or biased financial reports during negotiations.
What are the most common variable costs in an orthopedic surgery margin?
The most common variable costs include orthopedic implants, surgical disposables, and dedicated operating room staff time. These expenses are directly tied to case volume and fluctuate based on your clinical choices and vendor preferences. By managing these Physician Preference Items (PPI) effectively, you directly increase the margin for every procedure you perform, enhancing your value to the facility.