

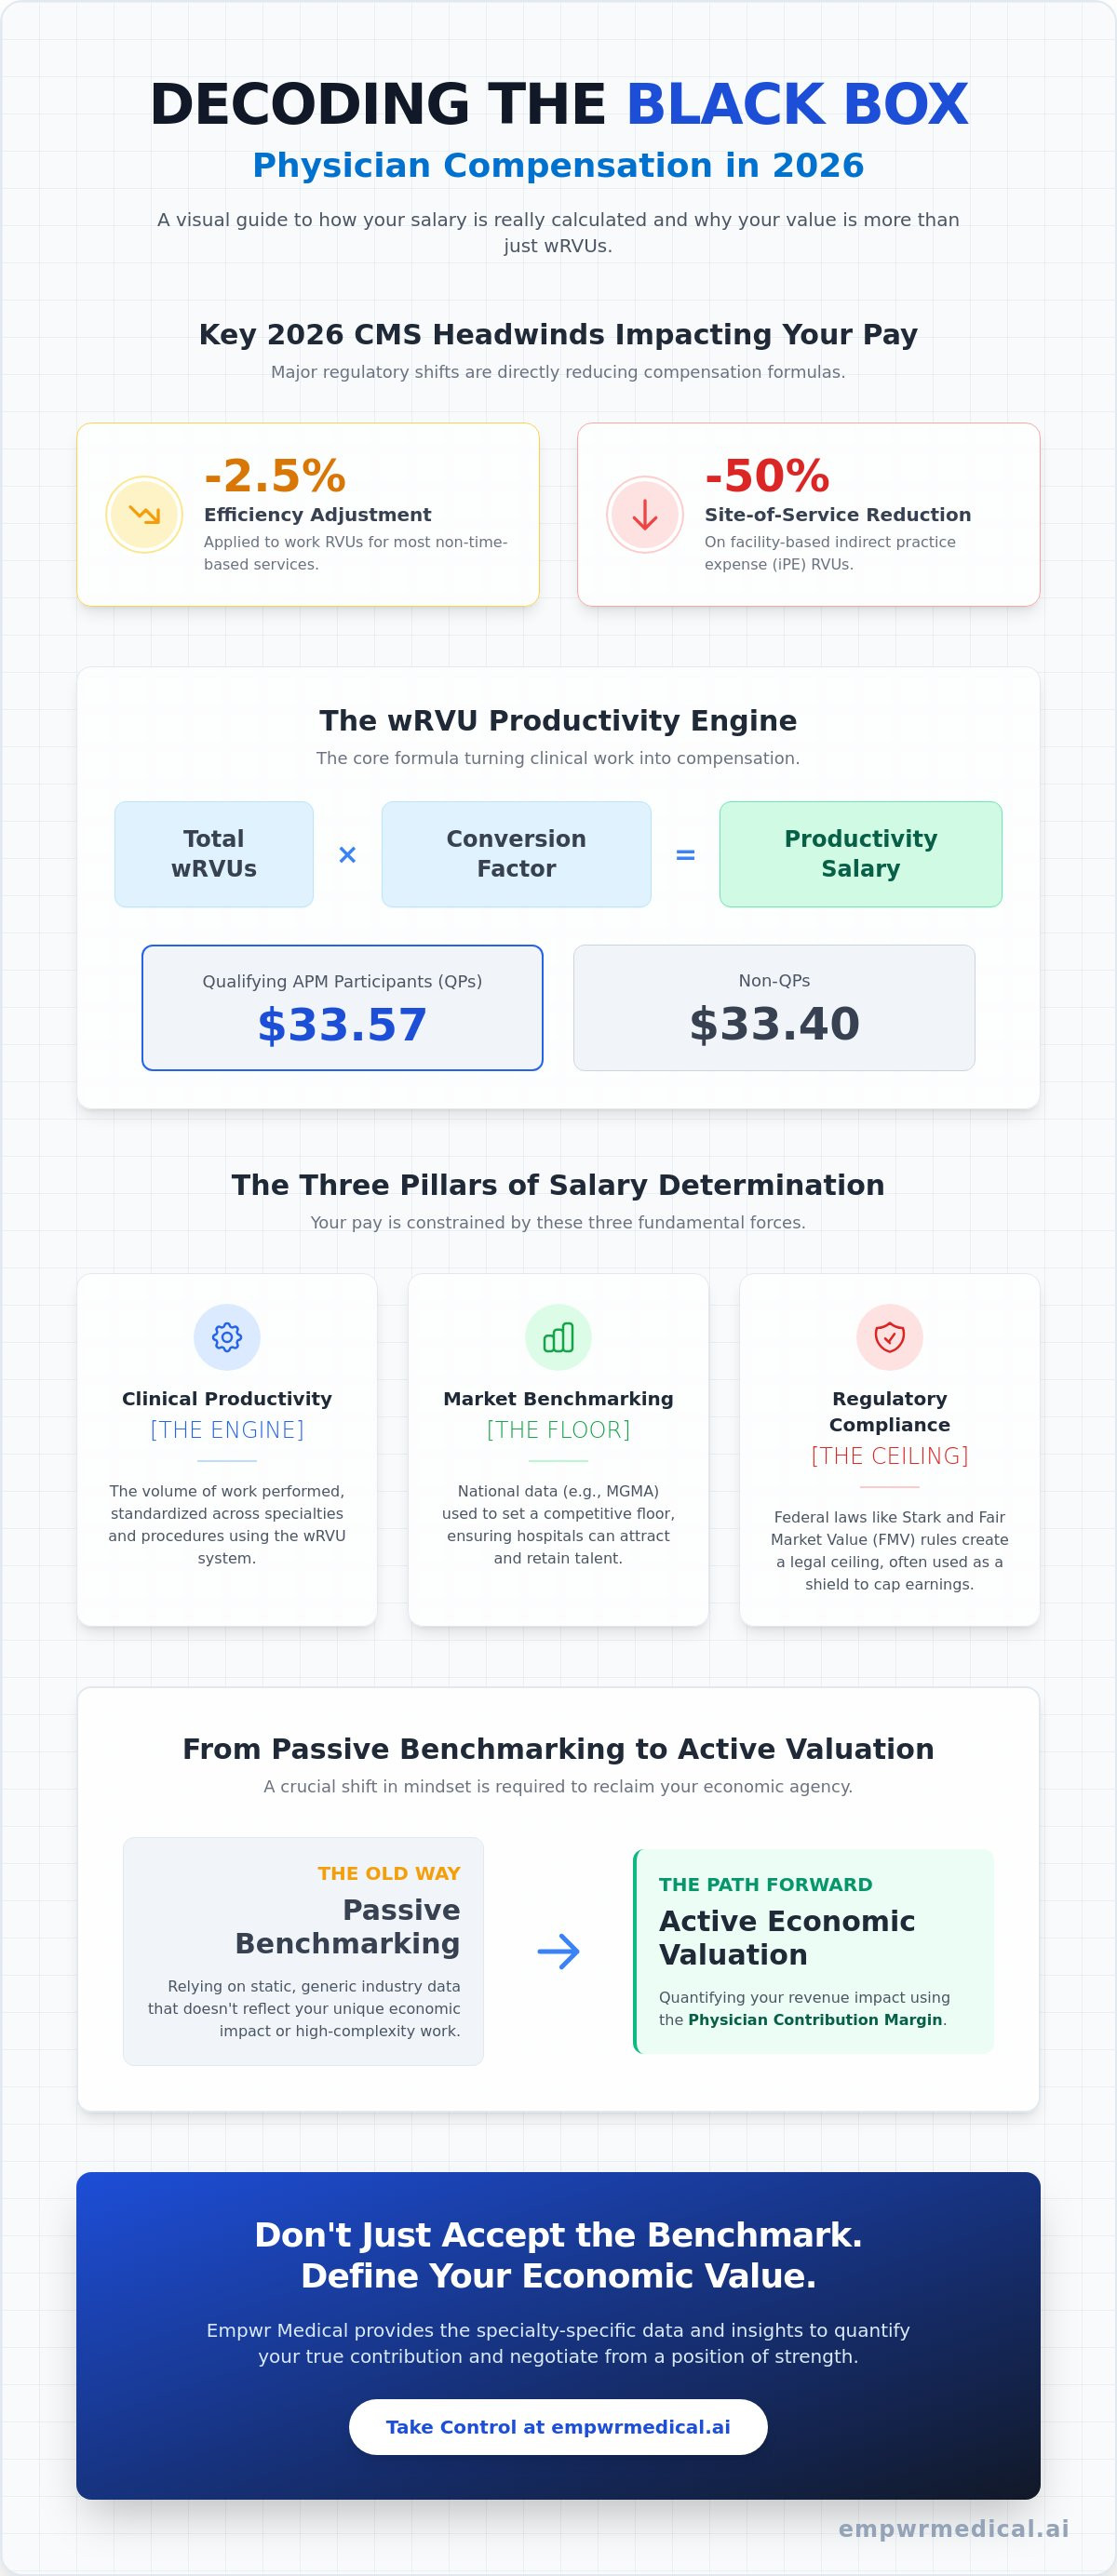
Did you know that for 2026, CMS has implemented a -2.5 percent efficiency adjustment to work RVUs for most non-time-based services? While you're providing high-level clinical care, your compensation is being filtered through a complex web of regulatory shifts and administrative formulas. It's common to feel undervalued when the "Fair Market Value" benchmarks used by your hospital seem like a black box. You deserve to know exactly how are physician salaries determined and why your specialty's economic valuation is shifting in real time.
We understand the frustration of tracking opaque wRVU bonuses and site-of-service payment differentials that now reduce facility-based indirect practice expense RVUs by 50 percent. This article provides total clarity on the 2026 landscape, including the impact of the 33.57 dollar conversion factor for Qualifying APM Participants. You'll learn to identify the specific data sources used for benchmarking and how to quantify your own economic impact. We'll explore the transition from passive market benchmarking to active economic valuation, giving you the rigorous evidence needed for your next professional negotiation.
In this article, you'll gain the clinical and financial clarity needed to interpret the complex economic models governing your professional value in 2026. We'll cover:
• The evolution of the productivity engine and why wRVUs remain the primary currency of medical compensation despite shifting regulatory landscapes.
• A detailed analysis of how are physician salaries determined through the lens of Fair Market Value (FMV) benchmarks and Stark Law compliance.
• The specific 2026 variables, including the -2.5 percent efficiency adjustment and MIPS incentives, that are redefining modern bonus structures.
• Strategies to quantify your clinical revenue impact using the Physician Contribution Margin rather than relying on static, generic industry data.
• How to leverage specialty-specific insights to move from passive benchmarking toward informed, strategic conversations with hospital administration.
The "Black Box" of Physician Compensation: An Overview
Physician pay isn't a static number. It's the dynamic output of a multi-variable economic equation. For decades, the logic of the physician's wallet was simple: revenue minus expenses equaled take-home pay. This "eat what you kill" model defined the era of private practice. However, as the industry has shifted toward hospital employment, that transparency has vanished. Today, understanding how are physician salaries determined requires looking past your paycheck and into the administrative strategies that dictate your worth.
In 2026, compensation models are increasingly designed around system-wide integration. Administrators don't just look at the individual; they look at how a physician's presence drives the profitability of the entire facility. This shift means that your salary is often a reflection of administrative goals, such as capturing downstream revenue or meeting specific 2026 Medicare mandates. With the 2026 Medicare Physician Fee Schedule implementing a -2.5 percent efficiency adjustment to most work RVUs, the formulas are becoming more restrictive and less intuitive for the individual clinician.
The Three Pillars of Modern Salary Determination
To decode your current contract, you must understand the three forces that create the boundaries of your pay:
- Clinical Productivity: This is the volume engine. Most systems use Relative Value Units (RVUs) to standardize the amount of work performed across different specialties and procedures. It's the primary way hospitals measure your effort.
- Market Benchmarking: This represents the competitive floor. Hospitals use national data from sources like MGMA or SullivanCotter to ensure they're paying enough to attract and retain talent without overpaying.
- Regulatory Compliance: This acts as the legal ceiling. Federal laws, including the Stark Law, mandate that pay remains within "Fair Market Value" (FMV). Administrators often use FMV as a shield to cap earnings, even when a physician's economic impact justifies a higher rate.
Why Transparency is Declining in Hospital Pay Models
The rise of "black box" bonuses has made it harder for clinicians to track their true earnings. While wRVUs provide some clarity, many 2026 contracts now include qualitative metrics like patient satisfaction scores or "citizenship" points that are difficult to quantify. Furthermore, massive health system consolidation has reduced local salary leverage. When one or two systems own every clinic in a region, the "market value" is no longer a competitive rate; it's whatever the dominant employer decides it should be.
There is a significant gap between how a physician perceives their value and how an administrator calculates it. While you see life-saving interventions and long hours, the system sees a Specialty-Specific Revenue Analysis and a contribution margin. Without a tool like the Physician Economic Value Platform, most doctors remain unaware of the actual revenue they generate for the system beyond their base salary. Understanding how are physician salaries determined is the first step in closing that information gap and reclaiming your professional agency.
Decoding the wRVU and Productivity Engine
While the broader administrative strategy sets the stage, the actual mechanics of your paycheck often rest on a single metric: the Work Relative Value Unit (wRVU). Historically, various methods of physician compensation have existed, but the wRVU has become the dominant language of clinical productivity. In the current 2026 environment, understanding how are physician salaries determined requires a granular look at the CMS Physician Fee Schedule. For the calendar year 2026, the Centers for Medicare & Medicaid Services (CMS) finalized specific conversion factors that serve as the baseline for productivity-based pay. For Qualifying APM Participants (QPs), the factor is $33.57, while Non-QPs see a factor of $33.40. The wRVU conversion factor is the multiplier that turns clinical effort into gross salary.
The reliance on wRVUs creates a standardized way to measure effort across different clinical tasks. However, this model often fails high-complexity specialties where the time spent on cognitive labor or patient management doesn't always translate into a high volume of billable units. Clinicians seeking to understand their true market positioning can utilize a Specialty-Specific Revenue Analysis to see beyond these standardized rates and identify where their actual economic contribution is being undercounted.
How wRVUs Are Calculated and Adjusted
A total RVU consists of three components: physician work, practice expense, and malpractice insurance. The work component (wRVU) is what most employment contracts use to calculate bonuses. It's critical to track these values annually because they aren't static. For CY 2026, CMS applied a -2.5 percent efficiency adjustment to the work RVUs for most non-time-based services. This means that for the same procedure performed in 2025, you might receive fewer credits in 2026. This adjustment is intended to account for efficiency gains over time, but for the individual physician, it often feels like a reduction in the value of their labor.
The Productivity Bonus: Incentives vs. Burnout
Many health systems utilize tiered productivity models where the dollar amount paid per wRVU increases once you surpass a certain threshold. While these are designed to incentivize high performance, they often lead to a "treadmill effect" where physicians must constantly increase their volume to maintain the same level of compensation. This is particularly challenging in 2026 as wRVU values for certain specialties, such as orthopedics and neurology, have seen year-over-year decreases. When how are physician salaries determined is tied solely to a declining wRVU value, the risk of professional burnout increases significantly as clinicians work harder for diminishing returns.
The Role of Fair Market Value (FMV) and Benchmark Data
Hospitals often frame salary negotiations as a clinical discussion, but they're actually navigating a rigid legal framework. Understanding how are physician salaries determined requires looking past your productivity and into the regulatory constraints of the Stark Law and the Anti-Kickback Statute. These federal laws mandate that physician compensation remains within the bounds of "Fair Market Value" (FMV). While intended to prevent fraudulent referrals, FMV is frequently used by health systems as a strategic ceiling to cap earnings, even when a clinician's economic impact justifies a higher rate.
To establish this ceiling, administrators rely on third-party survey data from organizations like MGMA and SullivanCotter. These benchmarks are treated as the definitive word on professional worth. However, relying solely on these surveys is problematic. The data is often self-reported and reflects market conditions from 12 to 18 months prior, creating a lag that fails to account for immediate economic shifts. When adjusted for inflation, Medicare physician payments have decreased by 33 percent since 2001. This downward pressure on the foundation of understanding the wRVU system means that benchmarks often reflect a devalued market rather than your specific professional contribution.
Breaking the Survey Monopoly
The dominance of survey-based benchmarks creates a lack of transparency in how hospitals select their target percentiles. An administration might choose the 50th percentile for one specialty and the 75th for another without providing a clear methodology for the distinction. To counter this, savvy physicians are looking toward objective data sources like CMS and RAND Corporation reports. These sources provide a more rigorous view of the healthcare landscape, acting as a necessary counter-weight to the static numbers found in traditional surveys. Utilizing a Specialty-Specific Revenue Analysis allows you to move beyond these generic benchmarks and enter negotiations with data that reflects your actual revenue generation.
Geographic Adjustments: Why Location Matters
Geography is a primary variable in the equation of how are physician salaries determined. The Geographic Practice Cost Index (GPCI) is used by CMS to adjust payments based on regional differences in operating costs. However, supply and demand dynamics often override simple cost-of-living metrics. In 2026, the projected shortage of up to 86,000 physicians is driving significant pay increases in rural and underserved areas. You might find that "location-adjusted" pay in a high-demand rural market far exceeds the compensation offered in saturated urban centers, despite a lower cost of living. Evaluating your offer requires analyzing whether your system's regional adjustment actually reflects the current scarcity of your specialty in that specific zip code.
Factors Influencing Total Compensation in 2026
Total compensation in 2026 is becoming a composite of clinical output and strategic alignment. While productivity remains a core driver, the question of how are physician salaries determined now incorporates significant "value-based" components. CMS has signaled this shift by permanently adopting policies for direct supervision via telehealth and establishing specific facility fees, such as the $31.85 payment for HCPCS code Q3014. These regulatory nuances mean that your total take-home pay is increasingly influenced by how well you manage a system's quality scores and its team of advanced practice providers (APPs).
The economic impact of APP supervision is an often overlooked variable in the compensation equation. A physician who effectively manages a team of PAs or Nurse Practitioners creates a significant revenue multiplier for the health system. In 2026, contracts are beginning to reflect this by offering supervision stipends or shared productivity bonuses. If your contract doesn't account for the administrative and liability burden of oversight, your total compensation likely fails to reflect your true professional utility. To see how your specific workflow compares to national standards, you can leverage the Physician Economic Value Platform to quantify these non-clinical contributions.
The Shift to Value-Based Compensation
Reimbursement models in 2026 are pivoting to reward efficiency over pure volume. This is partly a response to the -2.5 percent efficiency adjustment applied to work RVUs for most non-time-based services. Hospitals are replacing lost productivity revenue by focusing on MIPS incentives and population health metrics. Integrating these metrics into your contract requires a precise understanding of how your clinical outcomes reduce readmission rates and improve patient satisfaction scores. Quantifying "quality" in a dollar-driven system is difficult, yet it's essential for ensuring your pay remains competitive as the industry moves away from fee-for-service models.
Non-Clinical Revenue Streams
Leadership and administrative roles provide a critical hedge against declining wRVU values. Determining the market rate for call pay, medical directorships, and emergency coverage is essential for a balanced compensation package. In academic systems, the valuation of "protected time" for research and teaching must be rigorously defended. These roles often lack the clear benchmarking found in clinical work, making it easy for administration to undervalue administrative labor. Strategic physicians ensure their contracts define these roles with clear hourly rates or fixed stipends that align with 2026 Fair Market Value standards. This ensures that every hour spent away from the bedside is still contributing to your financial bottom line.
Reclaiming Your Value: Quantifying Your Economic Impact
Entering a contract negotiation without hard data is a strategic disadvantage. While most clinicians focus on what their peers earn, the most effective negotiations are built on the Physician Contribution Margin. This metric represents the net revenue you generate for the health system after subtracting direct and indirect operational costs. To truly grasp how are physician salaries determined at the executive level, you must stop viewing yourself as a cost center and start seeing yourself as a primary driver of system profitability. It's time to shift the conversation from salary averages to your individual economic impact.
Knowing your total revenue generated is significantly more powerful than knowing a generic salary benchmark. Benchmarks like MGMA are averages; your specific contribution margin is an objective fact. For example, a high-volume specialist might drive millions in "downstream" revenue through labs, imaging, and hospital admissions that never appear on a wRVU report. When you present these figures during a contract renewal, you change the power dynamic. You're no longer asking for a raise based on sentiment. Instead, you're presenting a Specialty-Specific Revenue Analysis that justifies your compensation through clear economic evidence.
Calculating Your Economic Value Score
Translating CPT codes and specialty workflows into system revenue requires a methodical approach. It involves tracking not just your direct billings, but the secondary revenue your practice generates for the facility. This includes the valuation of "protected time" and the efficiency gains you bring to the department. For a structured framework on this process, you can explore the Physician Economic Value Score: Quantifying Your Clinical Impact in 2026. By utilizing the Physician Economic Value Platform, you gain access to the clinical revenue analytics necessary to prove your worth in a dollar-driven environment.
The Future of Physician Advocacy
Advocacy is evolving from emotional appeals to data-backed strategic planning. In the past, physicians relied on anecdotes or informal networks to gauge their worth. Today, transparency tools like the Empwr Index Report allow for a more rigorous assessment. The Empwr Index is a specialty-specific metric that benchmarks a physician’s true economic contribution against national fee schedules. By using such metrics, you can identify precisely where your current pay lags behind your actual impact. Understanding how are physician salaries determined through these objective lenses empowers you to demand equitable pay. It turns the "black box" of hospital administration into a transparent conversation about professional value and economic reality.
Strategic Advocacy for the 2026 Market
The landscape of medical compensation is shifting from a volume-based treadmill to a complex, value-driven ecosystem. Understanding how are physician salaries determined requires more than a glance at generic percentiles. It demands a rigorous analysis of your contribution margin and the specific impact of 2026 Medicare efficiency adjustments. You shouldn't have to navigate these administrative "black boxes" without an objective evidence base. Clarity is your strongest tool in any negotiation.
Empwr Medical provides the steady assurance of data and methodology needed for informed professional conversations. Our physician-founded platform is designed specifically for clinical advocacy, utilizing authoritative CMS and RAND pricing data to bring hidden truths to light. By providing a specialty-specific revenue analysis tailored to 2026 market conditions, we bridge the gap between institutional data and your personal strategy. Take the first step toward economic clarity and calculate your true economic value with the Empwr Index. You have the clinical expertise; it's time to secure the economic recognition you've earned.
Frequently Asked Questions
What is the most common physician compensation model in 2026?
Hybrid models featuring a base salary plus productivity and quality bonuses are the most common standard in 2026. This structure is central to how are physician salaries determined in large health systems, as it balances guaranteed income with incentives for high-volume care. Most contracts now include tiered wRVU thresholds where your bonus rate increases as you exceed specific production targets.
How does the CMS conversion factor affect my take-home pay?
The CMS conversion factor serves as the primary multiplier that translates your clinical effort into actual dollars. For 2026, the factor is set at $33.57 for Qualifying APM Participants and $33.40 for Non-QPs. If your contract links bonus pay directly to the Medicare Physician Fee Schedule, any fluctuation in this factor directly impacts your gross earnings for the same volume of work.
Can I negotiate my salary if the hospital says it is at Fair Market Value (FMV)?
Yes, you can negotiate because Fair Market Value is a broad range rather than a single fixed number. Hospitals often cite the 50th percentile as a non-negotiable limit, but regulatory standards allow for higher compensation if your economic impact justifies it. Providing objective data on your contribution margin helps shift the focus from generic benchmarks to your specific professional value.
What is the difference between a wRVU and a total RVU?
A wRVU measures the specific work or clinical effort of the physician, while a total RVU incorporates practice expenses and malpractice components. Most employment contracts focus exclusively on the wRVU for productivity bonuses because it represents the clinician's direct contribution. Understanding this distinction is vital, as the 2026 efficiency adjustments primarily target the work component of non-time-based services.
How much of my salary should be based on quality metrics versus productivity?
In 2026, quality metrics typically account for 5 to 15 percent of total compensation. While productivity remains the primary driver of earnings, the shift toward Value-Based Care means an increasing portion of your pay depends on outcomes and patient satisfaction. Balancing these metrics ensures you're rewarded for clinical excellence without being penalized for the time required to manage complex cases.
What data sources do hospitals use to determine physician salary benchmarks?
Health systems primarily rely on national surveys from MGMA and SullivanCotter to set pay scales. These organizations collect self-reported data to create annual benchmarks. However, because this data often reflects market conditions from the previous year, it's essential to use a Specialty-Specific Revenue Analysis to capture the most current economic realities and 2026 regulatory changes.
Does my specialty affect how my salary is determined more than my location?
Specialty dictates your compensation floor, but location often determines your ceiling. While your specialty sets the base wRVU values, geographic scarcity and the Geographic Practice Cost Index (GPCI) cause significant regional pay variations. In 2026, the projected shortage of 86,000 physicians is driving systems in rural areas to offer significantly higher incentives than saturated urban markets.
How can I find out the actual revenue I generate for my healthcare system?
Determining your actual revenue requires looking beyond your paycheck at the net contribution margin you provide. This involves tracking your direct billings alongside the downstream revenue from labs, imaging, and referrals. Using a Specialty-Specific Revenue Analysis provides the objective evidence needed to understand how are physician salaries determined based on your true economic footprint rather than generic averages.