

Your wRVU production is a measure of your activity, but it's a remarkably poor indicator of your actual economic worth to the health system. While you're performing high-complexity procedures, the hospital's financial reporting often obscures the technical fees and downstream revenue that your specific expertise generates. You likely feel the weight of this transparency gap during contract discussions, where administrative friction makes it difficult to prove your true impact. Relying on generic benchmarks in an era where practice operating costs have climbed by 11.1% puts your professional autonomy and financial security at risk.
We understand that feeling undervalued by standard compensation models is more than a grievance; it's a data problem. This article explores how a precise specialty specific revenue analysis translates clinical data into actionable economic leverage. You'll learn how to move beyond the 2026 Medicare conversion factor of $33.40 and quantify your true contribution margin with clinical rigor. We will preview the methodology for uncovering hidden revenue streams and explain how data-backed insights from a Physician Economic Value Platform can provide the clarity you need to lead an informed conversation at the negotiating table.
Key Takeaways
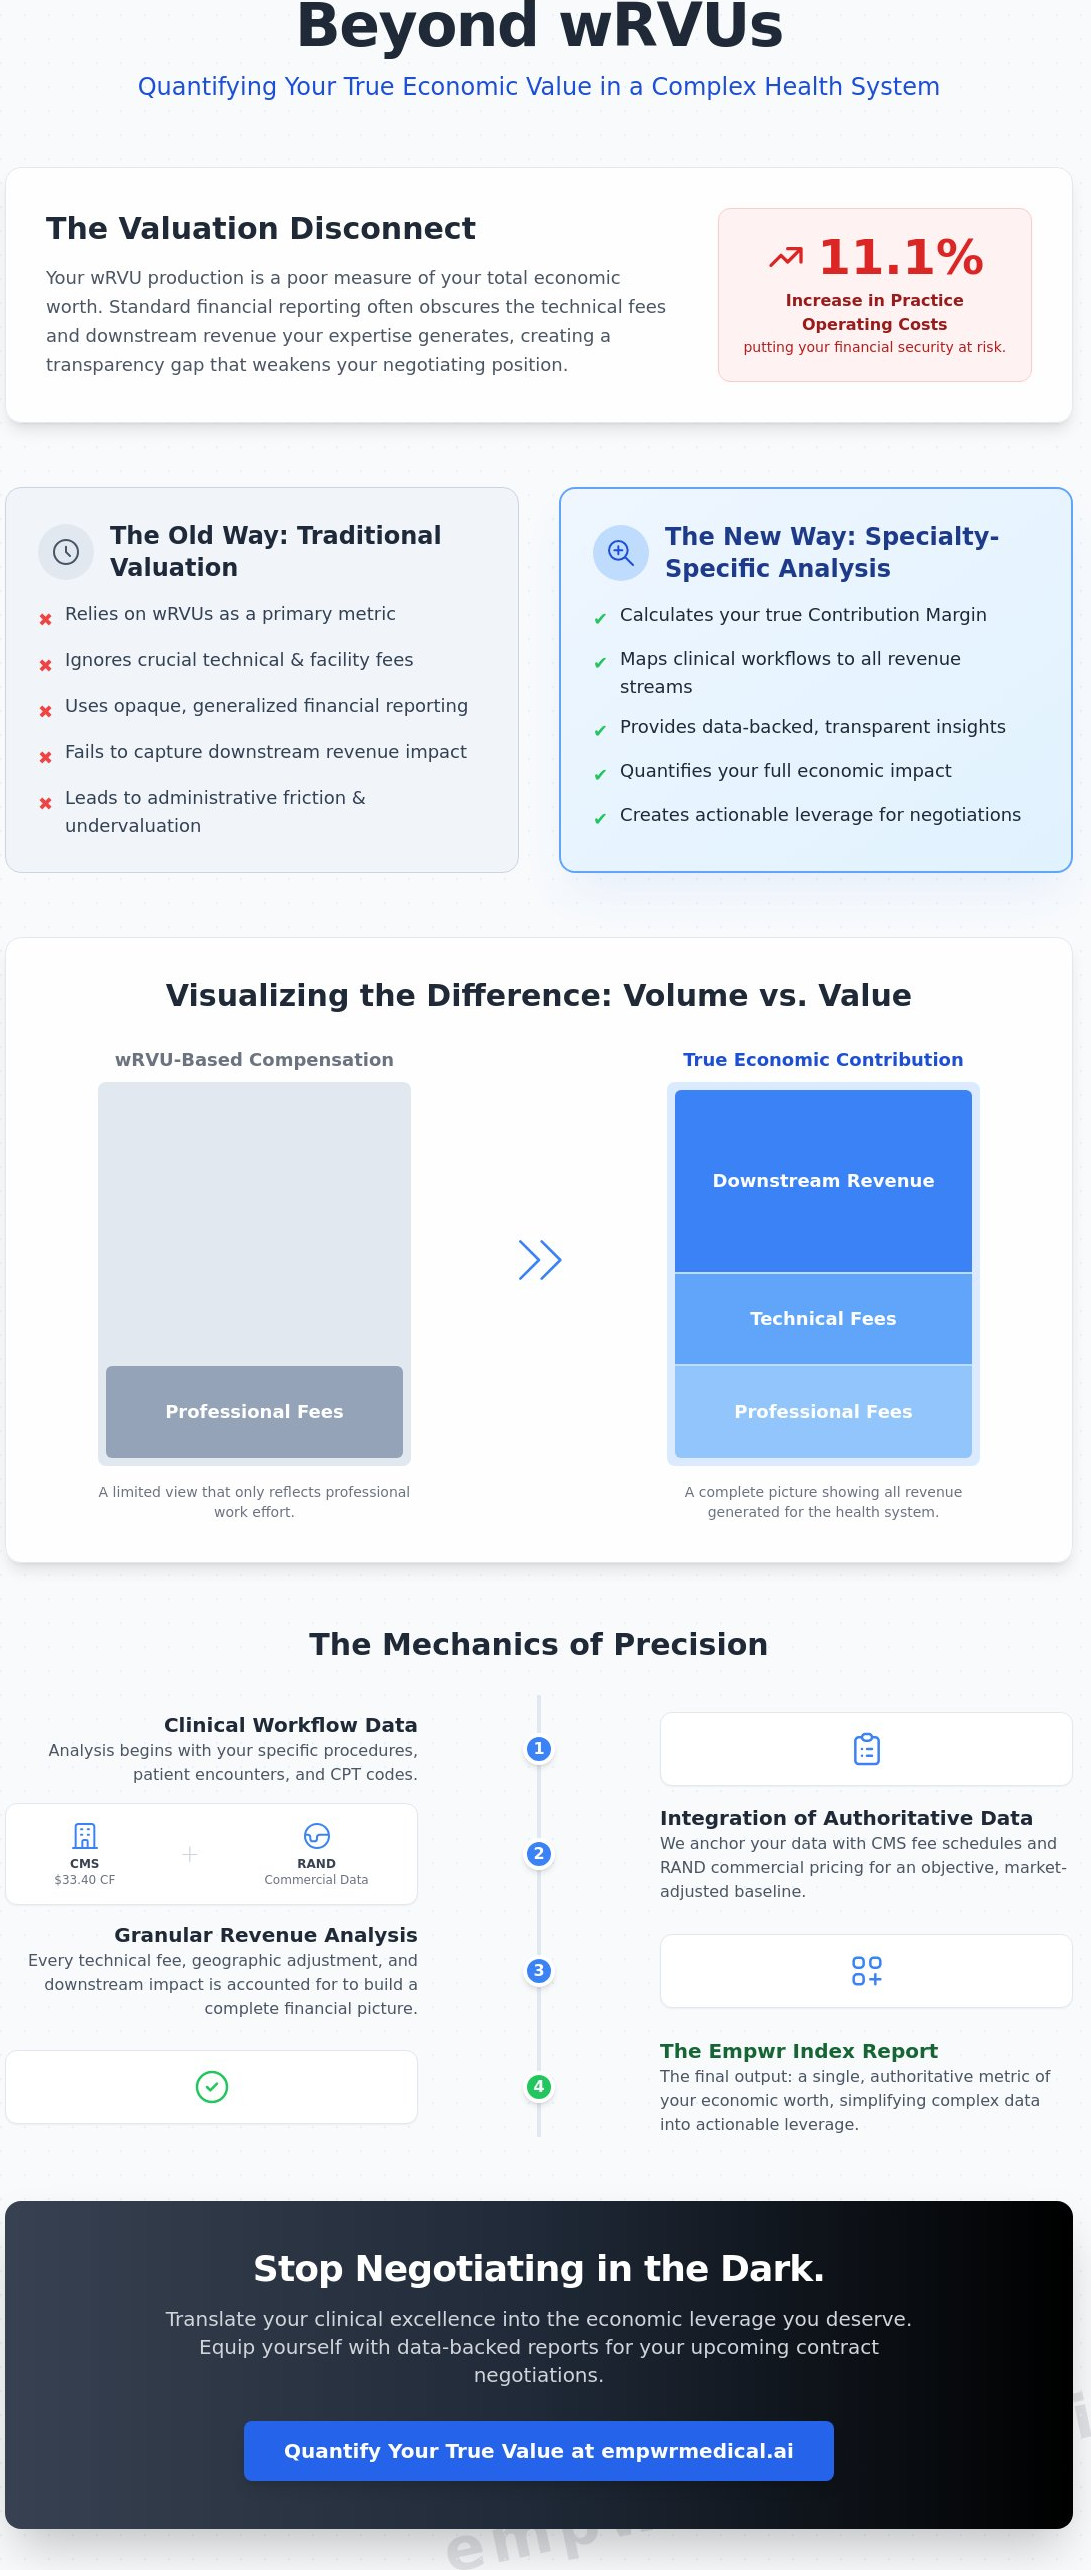
- Understand how mapping clinical workflows to technical revenue streams captures the full economic impact of your work beyond simple professional fees.
- Learn how the integration of CMS Fee Schedules and RAND commercial pricing data provides a precise, market-adjusted baseline for your value.
- Discover why a specialty specific revenue analysis is the key to calculating your true contribution margin and identifying revenue leakage.
- Equip yourself with data-backed reports that transform opaque financial reporting into actionable leverage for upcoming contract negotiations.
- See how the Empwr Index Report provides a single, authoritative metric of your economic worth to simplify complex strategic planning.
Beyond General Billing: Defining Specialty Specific Revenue Analysis
General hospital financial reporting often functions like a blunt instrument. It categorizes revenue into broad buckets that fail to account for the intricate nuances of specialized care. A specialty specific revenue analysis is a granular financial evaluation that maps clinical workflows to specific revenue streams, ensuring that every technical fee and downstream impact is accounted for. While traditional models focus on surface-level productivity, this methodology identifies the "slow financial drift" that occurs when a busy practice's revenue leakage outpaces its growth. Even as operating costs for medical practices increased by an average of 11.1% in 2025, many physicians remain unaware of the specific areas where their economic value is being diluted by generic accounting practices.
The Limitations of One-Size-Fits-All Financial Reporting
It's a mistake to measure a surgical subspecialty and a primary care clinic using the same financial yardstick. Most systems rely heavily on the Resource-Based Relative Value Scale to determine professional compensation, but this only tells part of the story. Generic benchmarks often ignore the specialized CPT codes that drive significant technical revenue for the hospital, such as facility fees for complex outpatient procedures. Ultimately, a specialty specific revenue analysis is a precision tool for financial transparency that converts complex clinical data into a clear map of institutional revenue. Without this level of detail, you're essentially negotiating in the dark, using data that was never designed to reflect your specific market reality.
The Physician Perspective: Revenue vs. Value
There's a critical distinction between gross billings and your actual contribution margin. Gross billings represent the total amount charged, but they don't reflect the efficiency or the strategic value you bring to the organization. By calculating revenue minus direct and indirect expenses, you gain a clearer picture of your financial sustainability. This analysis acts as a bridge between your clinical excellence and the hospital's bottom line. Today, the physician economic value score has become the new standard for high-level professionals who want to quantify their impact with precision. It moves the conversation away from simple volume and toward a holistic understanding of how your specialty drives the health system's economic engine.
The Mechanics of Precision: How Specialty-Specific Models Quantify Value
Generating a high-fidelity economic profile requires more than just internal hospital data. It demands a rigorous integration of external benchmarks that reflect the current regulatory and market environment. A specialty specific revenue analysis begins by establishing a baseline using the 2026 Medicare Physician Fee Schedule, which set the conversion factor at $33.40. This federal baseline provides a foundation for professional and technical fees, but it's only the first step. To capture the full scope of your economic impact, models must also incorporate geographic adjustments that account for regional cost variations and location-specific revenue potential. This methodical approach ensures that the resulting data is grounded in reality rather than administrative estimates.
Authoritative Data Sources: CMS and RAND
Objective evidence is the cornerstone of professional advocacy. Relying on internal hospital surveys often leads to skewed results because those datasets lack the breadth of the broader market. This is why physician fair market value data must be anchored in federal and independent sources. While CMS provides the regulatory floor, RAND pricing data offers a transparent look at commercial payer variations. This dual-source methodology reveals how commercial reimbursements often deviate significantly from Medicare rates. With practice operating costs having increased by 11.1% in 2025, using updated, independent data is the only way to ensure your valuation keeps pace with economic shifts. You can explore how these data points align with your specific clinical profile through the Physician Economic Value Platform.
Accounting for Specialty-Specific Nuance
Generic financial software frequently overlooks the complexities of specialized CPT codes and site-of-service differentials. A precise model accounts for the specific modifiers that reflect the intensity of your work and the ancillary services you manage. For example, the economic impact of a diagnostic suite or a specialized lab is often credited to the facility rather than the physician who directs the care. Precision modeling reattributes this value by:
- Quantifying the technical component revenue generated by physician-led procedures.
- Adjusting for PAMA laboratory cuts, which saw reductions of up to 15% on approximately 800 tests in early 2026.
- Evaluating the contribution of downstream referrals and facility fees associated with specific clinical workflows.
By translating dense institutional data into decision-ready reports, Empwr Medical provides the clarity needed to bridge the gap between clinical activity and institutional profit. This level of detail is essential for medical groups facing an average EBITDA margin of 5.7%. It transforms a standard productivity report into a strategic roadmap for professional growth and financial sustainability.
Contribution Margin vs. wRVUs: Why Volume Doesn’t Equal Value
For decades, the healthcare industry has relied on volume as a proxy for value. This reliance creates a fundamental misalignment between a physician's clinical output and their institutional worth. While you may be seeing more patients and generating more work units, these metrics don't necessarily translate to a healthier bottom line for you. The physician contribution margin, defined as total revenue generated minus both direct and indirect expenses, provides a much clearer picture of financial performance. Relying solely on physician relative value units explained for compensation is a structural flaw that favors the institution over the individual. It allows hospitals to maintain a predictable cost structure while ignoring the true economic engine of the practice.
The wRVU Trap: When Productivity Outpaces Compensation
Hospitals often prefer to keep physicians focused on wRVUs because it simplifies administrative reporting and shifts the risk of reimbursement volatility away from the system. However, this focus creates a trap. As practice operating costs increased by 11.1% in 2025, a static wRVU conversion factor means you're effectively earning less for the same amount of work. High volume can actually hide a stagnant or even negative contribution margin if the costs of providing that care are rising faster than productivity. A specialized case study on the orthopedic surgeon contribution margin reveals how much value generic wRVU models miss, particularly regarding high-margin technical fees and ancillary services. Eventually, every high-volume setting hits a point of diminishing returns where additional clinical effort no longer yields proportional economic gain.
Contribution Margin: The Negotiator’s Secret Weapon
When you enter a contract renewal, walking in with a specialty specific revenue analysis changes the entire dynamic of the conversation. You're no longer asking for a salary increase based on effort; you're presenting a data-backed case for your Return on Investment (ROI). This level of transparency allows you to prove your department's profitability by highlighting the specific revenue streams that generic reports often bundle into facility fees. It forces the administration to acknowledge the technical revenue and downstream referrals your expertise facilitates. Contribution margin is the most accurate reflection of economic impact. By shifting the focus from how much you work to how much value you generate, you position yourself as a strategic partner rather than just a cost center on a spreadsheet.
Turning Data into Leverage: Strategic Applications for Medical Groups
Data only becomes leverage when it's translated into the financial language of the C-suite. For medical groups, a specialty specific revenue analysis provides the necessary bridge between clinical performance and institutional strategy. While individual physicians use these insights for personal advocacy, medical groups utilize aggregated data to shape departmental growth and resource allocation. By presenting a clear picture of the contribution margin, groups can communicate their economic worth in terms of institutional ROI rather than just clinical volume. This shift in dialogue is essential in a market where the average EBITDA margin for office-based physicians was estimated at 5.7% in 2024, leaving little room for financial guesswork.
Contract Negotiation and Fair Market Value
Negotiating from a position of strength requires challenging the flawed internal data often provided by hospital administrations. Most institutions rely on generic surveys that fail to account for the specific technical revenue generated by high-complexity specialties. Independent analysis allows groups to ensure their compensation remains within Fair Market Value (FMV) while maximizing the physician’s share of the total economic pie. For instance, cardiologist economic value reports often justify higher base salaries by quantifying the massive downstream impact of cardiac service lines that wRVUs simply ignore. This evidence-based approach prevents groups from accepting low-ball offers based on incomplete financial reporting.
Strategic Planning and Resource Allocation
A granular revenue model is a prerequisite for making informed investment decisions. When a group considers expanding a service line or purchasing new diagnostic equipment, they must understand the specialty-specific ROI beyond simple billings. This analysis also helps quantify the economic risk of physician turnover. Losing a specialized provider in a field like neurosurgery or oncology doesn't just create a staffing gap; it results in a total loss of the technical and facility fees associated with their specific clinical workflow. Groups use these insights to advocate for better clinical support and administrative resources by proving that such investments directly protect the hospital's most profitable service lines.
Effective advocacy starts with having the right data at your fingertips. You can begin quantifying your department's true worth today by requesting a comprehensive Empwr Index Report. This tool transforms opaque institutional numbers into a clear, strategic roadmap for your group's financial future.
Empowering Your Future with the Empwr Medical Platform
Transitioning from a feeling of being undervalued to a state of data-backed clarity requires more than just intent; it requires a specialized infrastructure. The Physician Economic Value Platform is designed to serve as that infrastructure, providing a bridge between complex clinical activity and institutional financial strategy. By utilizing a specialty specific revenue analysis, the platform removes the administrative friction that often prevents physicians from proving their true economic impact. In an era where 73% of finance leaders report increasing claim denials, having an independent, rigorous methodology to track your professional worth is no longer a luxury. It's a fundamental requirement for professional advocacy and long-term financial sustainability.
The Empwr Index: Clarity in a Single Score
The core of the platform is the Empwr Index, a metric that summarizes complex financial inputs into a single, authoritative score. This index integrates the 2026 Medicare Fee Schedule, RAND commercial pricing data, and precise geographic adjustments to provide a decision-ready view of your economic value. Instead of presenting leadership with fragmented data points, you can lead informed conversations using a metric that health system executives recognize and respect. An annual SaaS subscription ensures that this monitoring remains continuous, reflecting real-time changes in fee schedules and practice operating costs. This ongoing visibility allows you to identify revenue leakage as it happens, rather than discovering it years later during a difficult contract renewal.
Designed by Physicians, for Physicians
Most financial reporting tools are built for hospital administrators, which explains why they often ignore the nuances of specialized clinical workflows. Our platform is physician-led, meaning it was built by experts who understand the difference between gross billings and true contribution margin. We prioritize transparency and fairness, ensuring that the technical revenue and ancillary value you generate are attributed correctly to your professional profile. Getting started is a straightforward process that begins with a comprehensive review of your specialty-specific codes and institutional data. By choosing a partner that values clinical rigor as much as financial accuracy, you can reclaim your seat at the table with the steady assurance of data.
The landscape of healthcare economics in 2026 is complex, but your professional value shouldn't be a mystery. You have the opportunity to move beyond generic productivity metrics and secure your future with a methodology grounded in reality. Quantify your true economic value with Empwr Medical and gain the leverage you need for your next strategic conversation.
Securing Your Professional Value Through Economic Clarity
Navigating the financial complexities of 2026 requires more than clinical expertise; it demands a strategic command of your own economic data. By shifting the focus from simple wRVU volume to a comprehensive contribution margin, you uncover the technical and downstream revenue that generic hospital reports frequently omit. A rigorous specialty specific revenue analysis provides the objective evidence needed to challenge internal benchmarks and secure a contract that reflects your true impact. Our physician-led methodology utilizes authoritative CMS and RAND data sources to generate the proprietary Empwr Index, offering you a single, actionable score for your professional advocacy.
It's time to move beyond the limitations of opaque institutional reporting and reclaim your seat at the negotiating table with the steady assurance of methodology. Get Your Specialty Specific Revenue Analysis Report and transform your clinical data into strategic leverage. You've dedicated your career to clinical excellence, and now you have the tools to ensure your compensation reflects the full scope of that commitment.
Frequently Asked Questions
What is the difference between revenue analysis and billing audits?
A billing audit is a retrospective review of claims designed to ensure coding compliance and accuracy. In contrast, a specialty specific revenue analysis is a strategic evaluation of your total economic contribution, including technical fees and downstream institutional revenue. While audits focus on preventing legal risk, revenue analysis identifies the hidden value that drives your professional worth.
How does specialty specific revenue analysis help in contract negotiations?
This analysis provides the data-backed evidence required to shift negotiations from simple productivity metrics to professional ROI. By presenting a clear report on your contribution margin, you can justify higher base salaries or better benefit structures with institutional leaders. It replaces administrative friction with objective clarity during the renewal process.
Why should I look at RAND pricing data instead of just hospital reports?
RAND data provides an independent benchmark for commercial payer reimbursements that internal hospital reports often obscure. Hospitals frequently use their own proprietary data to set a low ceiling for compensation discussions. Utilizing RAND data ensures your valuation reflects actual market rates for your specific clinical expertise and geographic location.
Can this analysis be used for both private practice and hospital-employed physicians?
Yes, this methodology is equally effective for both employment models. Hospital-employed physicians use it to ensure their compensation remains within fair market value, while private practice owners use it to identify revenue leakage and strategic expansion opportunities. It serves as a universal tool for any high-level professional seeking financial transparency.
What data do I need to provide to get an accurate revenue analysis?
You typically need to provide aggregated CPT code volumes, site-of-service identifiers, and specialty-specific modifiers. This information allows the platform to map your clinical activity to the most current fee schedules and commercial benchmarks. High-fidelity data ensures the resulting report is both accurate and decision-ready for strategic planning.
How often should a physician perform a specialty specific revenue analysis?
Most physicians should perform a specialty specific revenue analysis annually or at least six months before a contract renewal. Regular monitoring allows you to track shifts in Medicare conversion factors and commercial reimbursement trends. It ensures your economic profile remains grounded in the most current regulatory realities of the 2026 healthcare landscape.
Is contribution margin a better metric than wRVUs for all specialties?
Contribution margin is a superior metric for all specialties because it accounts for the actual costs of care and the technical revenue generated. While wRVUs only measure work effort, contribution margin measures financial sustainability. It's the only way to see if high-volume clinical settings are truly profitable after factoring in overhead and facility fees.
How does geographic location affect my specialty specific revenue potential?
Location significantly impacts your revenue potential through Medicare's Geographic Practice Cost Index and local commercial payer mix. A specialist in a high-cost urban center faces different economic pressures than one in a rural setting. Precision modeling adjusts for these regional nuances to provide a location-specific valuation that reflects your local market reality.