

What if the 2026 Medicare Physician Fee Schedule isn't just a list of reimbursement rates, but the hidden blueprint for your entire professional worth? While many providers view federal regulations as administrative noise, the reality is that CMS data for physician compensation serves as the economic DNA of your contract. You likely feel the frustration of hospital compensation math that lacks transparency, especially when wRVU targets seem disconnected from the revenue you actually generate. It's common to feel undervalued during negotiations when you don't have the same data set as the administrators across the table.
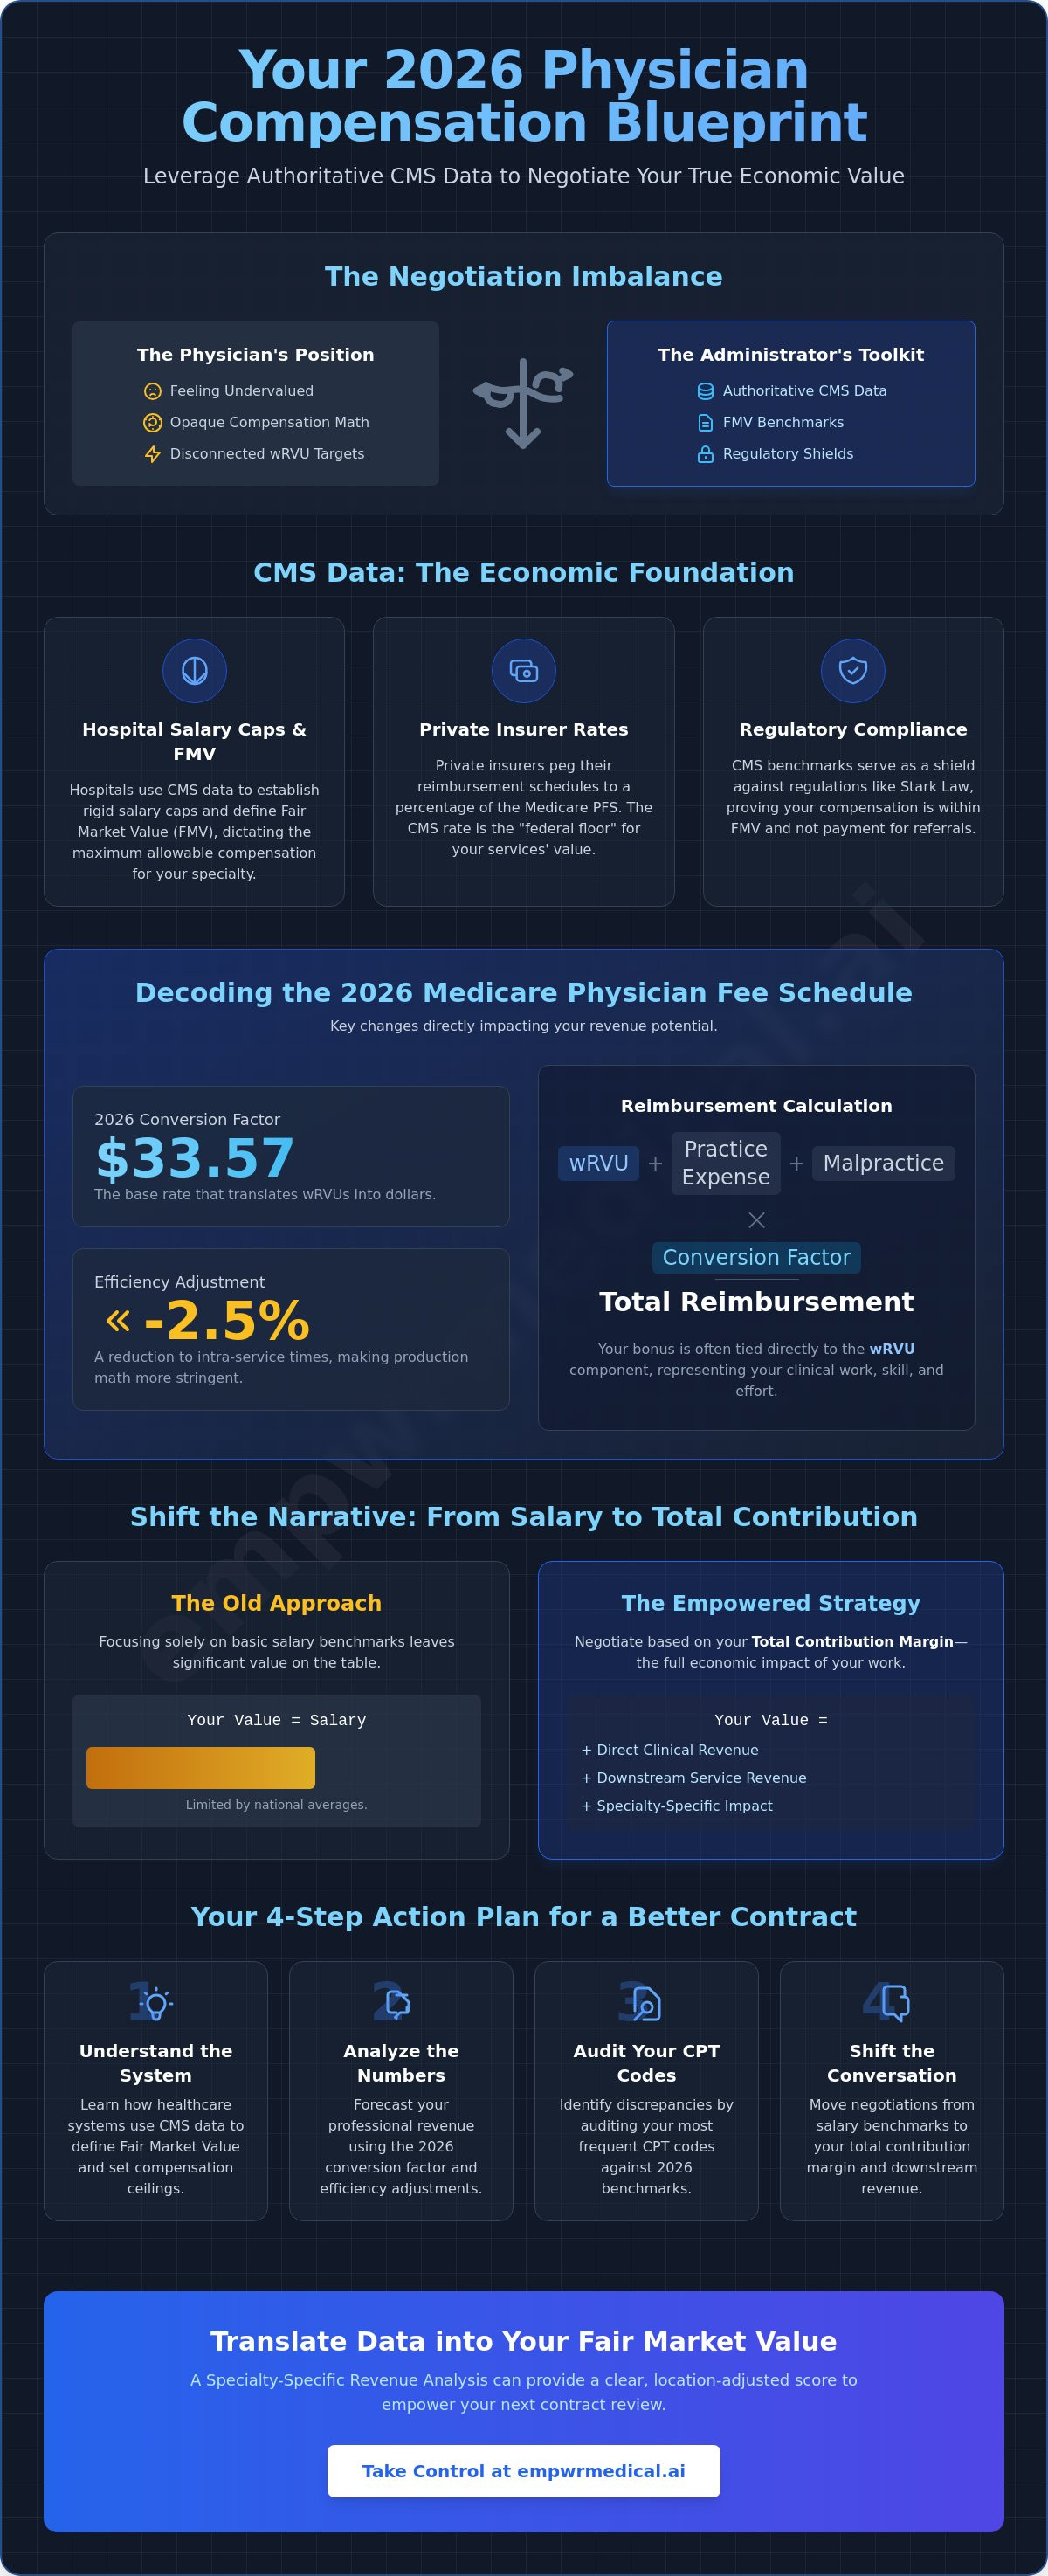
This guide will show you how to leverage authoritative data to decode your compensation model and negotiate from a position of objective clarity. You'll learn how the 2026 conversion factor of $33.57 and the new -2.5% efficiency adjustment directly impact your specialty's revenue potential. We'll examine the mechanics of the Physician Fee Schedule to provide actionable insights for your next contract review. By the end of this article, you'll have a clear understanding of your contribution margin and the tools needed to secure a deal that reflects your true economic value.
Key Takeaways
- Understand how healthcare systems utilize CMS data for physician compensation to define Fair Market Value and establish institutional salary ceilings.
- Analyze the 2026 Medicare Physician Fee Schedule components to accurately forecast your professional revenue based on the latest conversion factor and efficiency adjustments.
- Shift the negotiation narrative from basic salary benchmarks to your total contribution margin, accounting for the significant downstream revenue your clinical work generates.
- Execute a targeted audit of your most frequent CPT codes against 2026 benchmarks to identify hidden discrepancies in your current production model.
- Discover how a Specialty-Specific Revenue Analysis can translate complex regulatory data into a clear, location-adjusted score to empower your next contract review.
Understanding the Role of CMS Data in Physician Compensation Models
CMS data acts as the gravitational center for healthcare economics in the United States. It provides the standardized metrics that define how medical services are valued, processed, and reimbursed across every specialty. For clinicians, the Physician Payments Sunshine Act requirements have already established a precedent for financial transparency, but the 2026 market is moving deeper into the granular mechanics of production. Hospitals rely on CMS data for physician compensation to establish rigid salary caps, ensuring that every dollar paid to a provider can be traced back to a federal benchmark. This isn't just about administrative ease; it's about creating a defensible financial structure in an era of increased regulatory scrutiny.
As we move through 2026, the shift toward objective economic modeling has become the standard for high-level negotiations. Administrators use these datasets to define Fair Market Value (FMV), a critical threshold that dictates the maximum allowable compensation for a specific specialty and geography. By understanding this framework, you can access the same physician fair market value data that hospitals use to justify their offers. This level of transparency allows for a more balanced dialogue. It moves the conversation away from anecdotal evidence and toward quantified clinical impact.
The Intersection of Medicare Rates and Private Contracts
Many physicians believe their commercial contracts are independent of federal rates, but the math suggests a different reality. Private insurers almost universally peg their reimbursement schedules to a percentage of the Medicare Physician Fee Schedule. If CMS adjusts a work RVU (wRVU) value or the conversion factor, your commercial revenue typically follows suit. Knowing the federal "floor" is essential. It represents the minimum viable reimbursement for your services. You can't effectively negotiate for a higher "ceiling" in your private contract without first mastering the CMS data for physician compensation that dictates the underlying economics of your practice.
Regulatory Compliance: Stark Law and FMV
Compliance isn't just a concern for the hospital; it's a safeguard for your professional standing. Federal regulations like the Stark Law prohibit "excessive compensation" that could be interpreted as payment for referrals. Hospitals use CMS benchmarks as a shield during audits to prove that physician pay remains within the bounds of FMV. Utilizing objective data ensures that your contract is legally defensible for both parties. When you base your negotiation points on verified benchmarks, you're providing the hospital with the documentation they need to stay compliant while paying you what you're actually worth.
Decoding the 2026 Medicare Physician Fee Schedule (PFS) and wRVUs
The release of the 2026 Medicare Physician Fee Schedule (PFS) marks a critical shift in how clinical labor is quantified. CMS calculates these rates using three distinct components: work relative value units (wRVUs), practice expense (PE), and malpractice (MP) costs. While hospitals often focus on the aggregate reimbursement, your primary interest lies in the work component. This specific subset of CMS data for physician compensation determines the productivity benchmarks that likely dictate your bonus structure. For 2026, the inclusion of a -2.5% efficiency adjustment to intra-service times means that the math behind your production is more stringent than in previous years.
The wRVU as a Unit of Economic Currency
CMS determines the "work" intensity of specific CPT codes by analyzing the time, technical skill, and mental effort required for a procedure. Understanding why physician relative value units explained are the core of your contract is the first step toward financial clarity. A common pitfall occurs when hospitals use outdated conversion factors or fail to account for the 2026 efficiency cuts when setting your base salary. The wRVU serves as the standard measure of clinical labor intensity. If your employer isn't transparent about how they translate these units into dollars, you're negotiating in the dark.
Analyzing the 2026 Conversion Factor Adjustments
The 2026 conversion factor reflects a complex interplay between federal policy and legislative intervention. Due to the "One Big Beautiful Bill Act," the conversion factor for qualifying APM participants is $33.57, representing a 3.77% increase from 2025. For non-qualifying participants, the rate is $33.40. These numbers provide the mathematical floor for your gross revenue estimates. However, the value of these dollars is further modified by Geographic Practice Cost Indices (GPCI). These indices adjust for local variations in labor and overhead costs. A physician in Manhattan and a physician in rural Ohio may generate the same wRVUs, but their economic impact on the facility differs based on these location-adjusted multipliers.
To calculate your estimated revenue, you must multiply your total annual wRVU production by the relevant conversion factor and apply your local GPCI. This exercise reveals the gap between what you generate and what you're paid. As CMS continues to refine these rates to contain costs, hospitals often respond by increasing "productivity" demands to maintain their margins. Gaining access to a Specialty-Specific Revenue Analysis can help you verify if your current contract reflects these 2026 adjustments or if you're working for a diminishing return. Using CMS data for physician compensation in this way transforms a passive contract review into an active economic strategy.
How CMS Data Influences Fair Market Value and Contribution Margin
Fair Market Value (FMV) is often presented to physicians as a rigid ceiling, a non-negotiable limit dictated by federal compliance. However, FMV is not a single number but a calculated range derived from specific data inputs. When administrators evaluate CMS data for physician compensation, they're typically looking for a safe harbor to avoid Stark Law violations. The problem for most providers is that hospitals often rely on commercial survey data that reflects what other physicians are paid, rather than the objective economic value of the work itself. By shifting the focus to your contribution margin, you can redefine the negotiation around the actual revenue you bring to the health system.
Your contribution margin represents the total revenue generated by your clinical activities minus the direct variable costs of your practice. CMS data provides the most transparent way to estimate this, as it tracks not just your professional fees, but the facility fees and downstream services linked to your specialty. Relying on RAND pricing data for physicians alongside CMS benchmarks creates a high-fidelity map of your economic impact. This dual-data approach allows you to see the full picture of how your labor supports the hospital’s broader financial health, from imaging and lab referrals to inpatient admissions.
Contribution Margin vs. Take-Home Pay
Your base salary is frequently only a small fraction of the total economic value you provide. Hospitals benefit from a "halo effect" where one specialist's work drives revenue across multiple departments. For example, a cardiologist's diagnostic work leads to stress tests, echocardiograms, and potentially surgical interventions, all of which carry significant facility fees. Information asymmetry occurs when only the hospital has access to these downstream numbers. You can use CMS data for physician compensation to quantify these secondary revenue streams. This transforms you from a cost center in the eyes of management into a primary driver of institutional growth.
The Limitations of Traditional Salary Surveys
Traditional benchmarks like MGMA or SullivanCotter are often the default tools for FMV, but they have inherent flaws. These surveys rely on self-reported data that can be lagging by 12 to 18 months. They reflect past market conditions rather than the current regulatory environment. In contrast, CMS data provides a real-time, specialty-specific baseline that isn't subject to the same reporting biases. Surveys tell you what others are paid; objective data tells you what your work is worth. Transitioning your strategy toward these objective metrics ensures that your compensation reflects the actual economic reality of 2026 rather than an outdated industry average.
- Data Integrity: CMS benchmarks are based on actual claims, not voluntary surveys.
- Economic Clarity: Understanding the facility fee component clarifies your total system value.
- Compliance Safety: Using federal data as a benchmark provides a robust defense for FMV.
Practical Steps to Leverage CMS Data in Your Next Negotiation
Translating theoretical benchmarks into a tactical negotiation strategy requires a methodical approach. You aren't simply asking for a salary increase; you're presenting an objective audit of your professional output based on federal standards. By utilizing CMS data for physician compensation, you strip away the ambiguity of hospital accounting and focus on the verifiable economic floor. This process moves the conversation from "what I feel I'm worth" to "what the data proves I generate."
Follow these five steps to build your data-backed case:
- Step 1: Audit your top 10 CPT codes. Identify the procedures and codes that drive the majority of your clinical volume. Lookup their 2026 CMS reimbursement rates to understand the baseline revenue per encounter.
- Step 2: Aggregate your wRVU production. Calculate your total annual wRVU output against 2026 benchmarks. Be sure to account for the -2.5% efficiency adjustment applied to non-time-based codes this year.
- Step 3: Benchmark your conversion rate. Compare your current "dollar-per-wRVU" rate in your contract to the 2026 CMS conversion factor of $33.57 (for qualifying APM participants) or $33.40 (for non-qualifying).
- Step 4: Apply geographic adjustments. Use the Geographic Practice Cost Indices (GPCI) to justify a "Location and Specialty Adjusted" compensation review that reflects your specific market's overhead and labor costs.
- Step 5: Synthesize an Economic Value Report. Present a finalized document during your renewal that highlights your total contribution margin, including downstream revenue estimates.
Preparing Your Data-Driven Value Proposition
The key to a successful negotiation is framing CMS data for physician compensation as an objective third party. This removes personal friction and positions the data as the arbiter of fairness. Avoid emotional appeals or anecdotal comparisons to colleagues. Instead, focus on the "Clinical Revenue Estimate" derived from your actual production numbers. Lead with data-backed revenue generation figures. When you show an administrator exactly how your work populates the hospital’s bottom line, the burden of proof shifts to them to justify why your pay shouldn't match that impact.
Overcoming the "Medicare Floor" Argument
Administrators often argue that Medicare rates are too low to serve as a justification for higher pay. You should counter this by using the data to prove your efficiency and contribution margin. If your wRVU production is in the 75th percentile but your pay is in the 50th, the "low rates" argument fails to explain that gap. Request transparency regarding the hospital’s payer-mix data to see how commercial contracts (which often pay 120% to 150% of CMS rates) amplify your value. To get a precise look at these figures, you can request a Specialty-Specific Revenue Analysis to bring unassailable clarity to the table.
Empowering Your Strategy with the Empwr Medical Platform
Accessing raw federal datasets is only the first step toward professional autonomy. While government portals provide the numbers, they lack the context required for high-stakes negotiations. The Physician Economic Value Platform bridges this gap by synthesizing CMS data for physician compensation into a cohesive financial narrative. Instead of spending hours cleaning spreadsheets or decoding regulatory jargon, you receive a refined analysis that highlights your specific market value. This transition from raw data to decision-ready reports happens in minutes, allowing you to focus on clinical excellence while we handle the economic modeling.
Our methodology centers on the Empwr Index, a specialty-specific and location-adjusted clarity tool designed for the 2026 healthcare market. We translate complex CMS and RAND datasets into a single physician economic value score. This score serves as a standardized metric of your clinical impact, accounting for the -2.5% efficiency adjustments and the latest conversion factor shifts. By using physician-led data tools, you gain the upper hand in an industry that has historically used information asymmetry to its advantage.
From Data Points to Informed Conversations
The Empwr Index Report facilitates a transparent dialogue between you and your administration. It accounts for the unique nuances of your clinical workflow, such as high-acuity patient mixes or specialized procedural volumes that generic surveys often overlook. Having this authoritative intelligence at your disposal is like having a data-driven mentor in your pocket during contract reviews. It ensures that the conversation remains grounded in objective reality. When you present a specialty-specific revenue analysis, you aren't just making a request; you're providing a roadmap for a fair and sustainable partnership.
Next Steps: Securing Your Economic Future
The 2026 market demands a more sophisticated approach to professional valuation than the models used even two years ago. Legislative changes and the shift toward value-based models mean that your economic worth is more tied to CMS data for physician compensation than ever before. Investing in your own economic data provides a long-term ROI that far exceeds the cost of the analysis. It protects you against stagnant wages and ensures your compensation reflects the actual revenue you generate for your facility. Gaining clarity on your true market worth is the most effective way to secure your financial future. Request your Empwr Index Report today to start your next negotiation from a position of unassailable economic clarity.
Securing Your Economic Value in the 2026 Market
Mastering the intersection of clinical production and economic reality is no longer optional for the modern physician. By decoding the 2026 Physician Fee Schedule and understanding your contribution margin, you transform from a passive employee into a strategic partner. You've seen how CMS data for physician compensation provides the only objective floor for these high-stakes conversations. Relying on outdated surveys or opaque hospital math is a risk your career can't afford. Professional autonomy begins with the steady assurance of data and methodology.
True clarity requires a framework that respects the complexity of your specialty and your specific market. Our physician-led platform utilizes authoritative 2026 CMS and RAND data to provide location-adjusted accuracy that generic benchmarks simply can't match. It's time to bridge the information gap and enter your next negotiation with the confidence of objective evidence. Calculate your true economic value with the Empwr Index Platform and take command of your professional future. You've earned the right to an informed conversation about your worth.
Frequently Asked Questions
How often does CMS update the Physician Fee Schedule for compensation benchmarks?
CMS updates the Physician Fee Schedule annually to reflect current economic shifts and legislative changes. The final rule is typically released by October 31 each year and becomes effective on January 1. This consistent cycle ensures that CMS data for physician compensation remains the most up-to-date benchmark for clinical labor and reimbursement rates across the industry.
Can I use CMS data if I am in a specialty that does not rely heavily on Medicare?
Yes, CMS data is a vital tool for all specialties regardless of their specific patient mix. Most private insurers mathematically tether their commercial reimbursement rates to a percentage of the Medicare Physician Fee Schedule. Understanding the federal floor allows you to calculate the expected commercial ceiling for your services, providing leverage during negotiations with any payer or employer.
What is the difference between CMS payment data and Fair Market Value?
CMS payment data refers to the specific reimbursement rates set by the government, while Fair Market Value is a broader economic range. FMV utilizes CMS data for physician compensation alongside other benchmarks to determine a pay range that is defensible under Stark Law. While CMS provides the raw economic inputs, FMV is the legal application of that data to ensure contract compliance.
How does the 2026 conversion factor affect my productivity bonus?
The 2026 conversion factor acts as the primary multiplier for your wRVU production. For qualifying APM participants, the rate is $33.57, which directly scales the gross revenue tied to your clinical work. Any change in this factor, combined with the new -2.5% efficiency adjustment, shifts the total dollar value of your productivity and your subsequent bonus potential.
Is CMS data more accurate than MGMA or other salary surveys?
CMS data is generally considered more objective because it's derived from actual claims rather than voluntary, self-reported surveys. While MGMA provides insight into what your peers are currently paid, CMS data reveals the actual revenue value of the work performed. This makes it a more reliable tool for calculating your contribution margin and true economic impact.
How can I access my own provider-level utilization data from CMS?
You can access provider-level data through the Medicare Physician and Other Practitioners Public Use Files on the official CMS website. This dataset contains granular information on the services and procedures you have provided to Medicare beneficiaries. For tracking financial relationships with industry, the Open Payments database provides a separate, searchable record of payments and transfers of value.
What happens if my hospital’s wRVU rate is lower than the CMS benchmark?
A lower internal wRVU rate often indicates that the hospital is retaining a larger share of the revenue you generate. This discrepancy is a primary driver of feeling undervalued during contract reviews. If you identify this gap, you should request a specialty-specific revenue analysis to bring transparency to how your production is being converted into institutional revenue.
Does CMS data account for geographic differences in the cost of living?
Yes, CMS utilizes Geographic Practice Cost Indices to adjust for regional variations in labor, rent, and overhead. These indices ensure that the value of your work is modified to reflect the specific economic realities of your practice location. This prevents a "one size fits all" approach and provides a much more accurate valuation of your clinical labor in your specific market.