

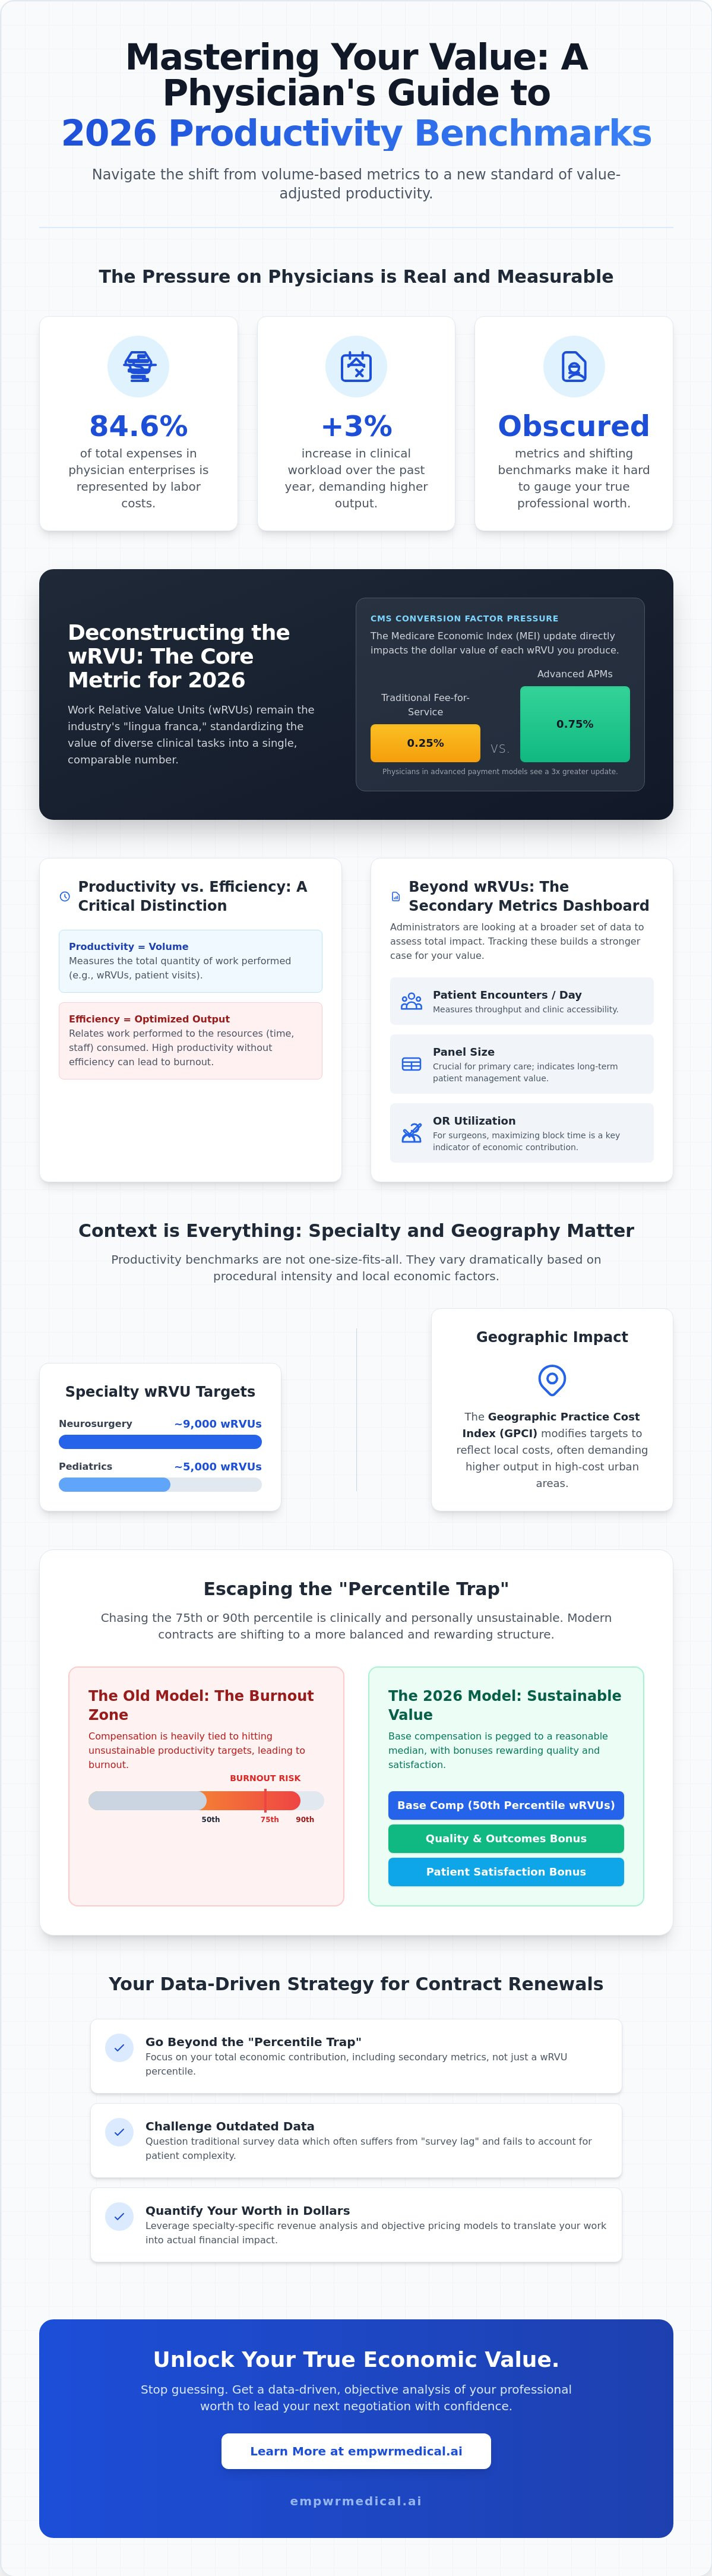
Your clinical workload increased by 3% over the last year, yet the metrics used to define your professional worth often remain obscured by administrative complexity. With labor representing 84.6% of total expenses in physician enterprises, you're the most significant driver of institutional value, though you might not feel that way during budget meetings. You likely recognize that 2026 physician productivity benchmarks are shifting, but understanding how these numbers apply to your specific geography and specialty is a different challenge entirely.
We're here to bridge the gap between dense institutional data and your personal professional strategy. This guide empowers you to master the metrics that define your economic value, moving beyond the confusion of standard wRVU calculations. You'll gain a clear understanding of current wRVU targets and learn how to leverage this data for fairer contract negotiations. We'll break down the latest 2026 benchmarks, provide a framework for calculating your total economic contribution, and give you the confidence to lead your next renewal discussion with objective evidence.
Key Takeaways
- Understand how the shift toward value-adjusted clinical output is redefining standard physician productivity benchmarks for the 2026 landscape.
- Identify the critical differences between cognitive and procedural wRVU targets and how geographic cost adjustments impact your local performance expectations.
- Learn why traditional survey data often fails to account for patient complexity and how "survey lag" can disadvantage you during compensation reviews.
- Develop a data-driven strategy for contract renewals that moves beyond the "percentile trap" to focus on your true economic contribution.
- Discover how to quantify your professional worth in actual dollars by leveraging specialty-specific revenue analysis and objective pricing models.
What Are Physician Productivity Benchmarks in 2026?
In the current economic climate, physician productivity benchmarks serve as the primary yardstick for professional value. They aren't merely administrative hurdles; they're standardized metrics designed to quantify clinical output against a peer group. For 2026, these benchmarks are evolving beyond simple volume counts. We're seeing a steady transition toward value-adjusted productivity, where the complexity and quality of care begin to influence the raw data. Organizations like the Medical Group Management Association (MGMA), SullivanCotter, and the Centers for Medicare & Medicaid Services (CMS) provide the foundational datasets that define these standards. Understanding these numbers is the first step in ensuring your compensation reflects your actual contribution to the health system.
It's vital to distinguish between productivity and efficiency. While productivity measures the total volume of work you perform, Health care efficiency looks at that work in relation to the time and resources consumed. You can be highly productive by working eighty hours a week, but that doesn't necessarily mean you're efficient. High productivity without efficiency often leads to burnout and administrative friction. In 2026, hospitals are looking for the sweet spot where high output meets optimized resource use.
The Role of wRVUs in Modern Benchmarking
Work Relative Value Units (wRVUs) remain the "lingua franca" of the industry because they normalize work across disparate clinical tasks. You can find the mechanics of this system in our guide on physician relative value units explained. In 2026, the CMS conversion factor continues to exert significant pressure on these benchmarks. With the Medicare Economic Index (MEI) update set at 0.25% for traditional fee-for-service models and 0.75% for advanced alternative payment models, the weight of each wRVU is more critical than ever. Despite their flaws, wRVUs provide a predictable, specialty-specific baseline that administrators use to justify salary tiers and bonus structures.
Beyond the wRVU: Secondary Productivity Metrics
While wRVUs dominate the conversation, secondary metrics provide the context that raw units lack. Administrators are increasingly looking at a broader dashboard to determine a physician's total impact. Key secondary metrics include:
- Patient encounters per day: This measures throughput and accessibility, balancing the need for volume with the necessity of patient satisfaction.
- Panel size: For primary care and chronic disease management, the total number of unique patients managed is a critical indicator of long-term value.
- Operating room (OR) utilization: For surgical specialties, the ability to maximize block time is often as important as the complexity of the cases performed.
By tracking these metrics alongside your wRVU targets, you can build a more comprehensive argument for your professional worth during contract negotiations.
2026 Productivity Benchmarks by Specialty: A Comparative Review
Physician productivity benchmarks aren't a monolithic standard; they vary significantly based on the procedural intensity of your specific specialty. A neurosurgeon's annual target of 9,000 wRVUs reflects a different economic reality than a pediatrician's goal of 5,000. Beyond specialty lines, geographic adjustments play a decisive role in how these numbers are applied. The Geographic Practice Cost Index (GPCI) modifies Medicare payments to reflect local overhead and malpractice costs, which directly influences how hospital systems set local productivity expectations. In 2026, we're seeing a shift where administrators in high-cost urban centers demand higher wRVU outputs to offset lower local conversion margins.
We're also tracking the emergence of "burnout-adjusted" benchmarks in 2026 employment contracts. These models acknowledge that consistently hitting the 75th or 90th percentile is clinically and personally unsustainable. Instead, many modern contracts now peg base compensation to the 50th percentile, with quality and patient-satisfaction bonuses serving as the primary drivers for total earnings. This reflects a broader understanding that high-volume throughput shouldn't come at the expense of physician longevity. It's a move toward a more sustainable equilibrium between clinical demand and professional well-being.
Primary Care and Internal Medicine Targets
For Family Medicine and Internal Medicine, 2026 targets are increasingly influenced by value-based care metrics rather than raw volume alone. While the median wRVU percentile remains a common baseline, it doesn't always capture the complexity of chronic disease management or the time required for care coordination. Utilizing a wRVU analysis by specialty allows cognitive physicians to see how their work compares to national peers who are also transitioning toward risk-based models. In private practice, physicians often face higher productivity thresholds compared to their academic counterparts, whose clinical targets are usually reduced by 20% to 30% to accommodate research and teaching duties.
Surgical and High-Acuity Specialty Benchmarks
High-acuity specialties like Orthopedic Surgery, Cardiology, and Neurosurgery continue to see benchmarks driven by high-intensity CPT codes. However, these metrics frequently overlook the "hidden" work of the surgical cycle. Pre-operative coordination and post-operative care are often bundled into the global surgical fee, making it difficult for surgeons to quantify the actual hours spent on patient management. Even large organizations, as seen in reports on VHA physician staffing and productivity, struggle to reconcile clinical output with the administrative demands of high-complexity cases.
Understanding these nuances is essential for a successful contract negotiation. If you're unsure how your current targets align with the market, it's worth requesting a specialty-specific revenue analysis to clarify your true economic standing. This data-driven approach ensures you aren't being measured against an irrelevant or outdated standard.
The Flaws in Traditional Benchmarks: Survey Data vs. Economic Reality
While administrators often present physician productivity benchmarks as objective truths, these numbers frequently fail to reflect the nuance of modern clinical practice. The most persistent objection from frontline clinicians is that standard benchmarks don't account for specific patient complexity. A wRVU generated during a routine follow-up is weighted the same as one earned during a high-acuity consultation for a patient with multiple comorbidities. This lack of granularity creates a disconnect between the actual cognitive effort required and the numerical output recorded in the system. When benchmarks ignore the "hassle factor" of complex care, they cease to be a measure of value and become a tool for simple volume enforcement.
We're also seeing the persistent issue of "Survey Lag" in 2026 negotiations. Most health systems rely on data sets collected in 2024 or 2025 to set 2026 targets. This two-year delay means your current professional worth is being judged against an economic landscape that has already shifted. Relying on outdated data is a significant factor in how are physician salaries determined, often leading to compensation models that don't reflect current inflation or increased administrative burdens. To secure a fair contract, you must look beyond these historical snapshots and focus on real-time economic indicators.
The Selection Bias in National Surveys
National benchmarks are heavily skewed by the participation of large, integrated health systems that have the administrative resources to report data. This creates a "Missing Middle" where independent practices and smaller groups are often excluded from the high-level data sets. Because large systems often have different operational efficiencies and payer mixes, their data might not be relevant to your specific practice environment. Your participation in these surveys, or lack thereof, directly affects the perceived "Fair Market Value" that hospitals use to justify your salary caps.
Contribution Margin: The Metric Hospitals Don’t Share
Hospitals typically focus on productivity, but they rarely share your "Contribution Margin." This metric is defined as the total revenue you generate minus your direct variable costs. It represents the actual profit you bring to the organization. A physician with lower raw productivity might actually have a higher contribution margin than a high-volume peer if they manage resources more effectively or generate higher downstream revenue. Understanding this number allows you to counter-argue "low" productivity scores by demonstrating your true fiscal impact on the hospital's bottom line. It's the difference between being a "cost center" and a primary driver of institutional solvency.
How to Use Benchmarks in 2026 Contract Negotiations
When you enter a contract renewal, you must treat physician productivity benchmarks as a defensive floor rather than a performance ceiling. Administrators often use national medians to cap earnings, but you can flip this narrative by using the same data to highlight institutional inefficiencies. Start by using a structured framework for evaluating the compensation package in a physician contract against the most recent 2026 datasets. If your compensation doesn't align with the 2026 CMS conversion factor adjustments or current RAND pricing models, the benchmarks are being used against you, not for you.
You should be particularly wary of the "Percentile Trap." This is a common administrative tactic where the hospital offers the 50th percentile of compensation for the 50th percentile of productivity. On the surface, it sounds fair. Economically, it's often a losing proposition for the physician. By the time you hit the 50th percentile of productivity, you've typically covered your entire salary and departmental overhead. Every wRVU generated beyond that point is nearly pure profit for the hospital. Aiming for a higher compensation percentile relative to your productivity percentile isn't "asking for too much"; it's asking for a fair share of the margin you've created.
Gathering Your Internal Productivity Data
Don't walk into a negotiation relying on the hospital's summarized reports. You need the granular data to spot "Benchmarking Outliers" caused by factors outside your control. Request a comprehensive CPT frequency report and a raw wRVU breakdown for the last twelve months. Spot-check these against your own surgical logs or patient schedules to ensure no codes were "dropped" by the billing department. You should also document "non-clinical" productivity, such as time spent on committee leadership, teaching, or research, which national physician productivity benchmarks often ignore but add significant institutional value.
Tactical Negotiation Conversations
Shift the conversation from "units of work" to "economic contribution." Use phrasing like, "While my raw wRVU productivity is at the 55th percentile, my economic contribution is significantly higher due to my low variable cost per case and high downstream referral value." You can strengthen this argument by utilizing a physician economic value score framework. This allows you to negotiate for "threshold adjustments" that account for support staff shortages or EMR inefficiencies that have slowed your throughput. To ensure you have the most accurate data for these discussions, you should request a specialty-specific revenue analysis before your next meeting.
The Empwr Index: A New Standard for Physician Valuation
Traditional physician productivity benchmarks provide a snapshot of work performed, but they often fail to quantify the economic result of that work. The Empwr Index serves as a more holistic alternative to standard surveys like the MGMA DataDive. Instead of relying solely on self-reported survey data, this platform utilizes objective CMS fee schedules and RAND pricing data to translate raw wRVUs into actual revenue estimates. This methodology ensures that your professional value is grounded in current market pricing rather than historical averages. By integrating these diverse datasets, you gain a transparent view of how your clinical labor contributes to the bottom line.
Accuracy requires a granular approach that accounts for regional economic variance. The Empwr Index incorporates location-adjusted data, ensuring that a physician in a high-cost-of-living area isn't being measured against an irrelevant national median. This precision allows for a specialty specific revenue analysis that reflects the unique payer mix and operational realities of your specific market. It transforms a vague productivity score into a clear financial statement.
Translating Work into Economic Reality
Empwr Medical bridges the gap between clinical CPT codes and institutional revenue. By applying contemporary reimbursement rates to your specific volume of work, the platform generates reports that administrators cannot easily dismiss. It's a physician-founded tool for financial clarity. These "Negotiation-Ready" documents provide the objective evidence needed to move a conversation from anecdotal performance to quantifiable economic impact. You're no longer just reporting units of work; you're demonstrating your role as a primary revenue generator.
Continuous Monitoring for Strategic Planning
Relying on an annual review for compensation adjustments is a reactive strategy that often leaves money on the table. The Physician Economic Value Platform shifts the focus toward year-round value tracking. Both groups and individual clinicians can use the SaaS platform to monitor their economic impact in real-time. This continuous visibility allows you to adjust your clinical focus or address support staff inefficiencies before they become permanent fixtures in your annual performance data. Empower your next professional conversation with the steady assurance of data.
Secure Your Professional Value with Data
Mastering 2026 physician productivity benchmarks is more than a compliance exercise; it's a strategic necessity for professional longevity. You've seen how raw wRVU data often fails to capture your clinical complexity or your specific geographic reality. By shifting the focus from simple volume to your total contribution margin, you move from a position of administrative uncertainty to one of quiet confidence. True professional advocacy begins with the ability to translate your daily clinical labor into its actual economic result.
Empwr Medical provides a physician-founded platform designed specifically to bring this level of clarity to your next contract negotiation. By utilizing authoritative CMS and RAND data for 2026 accuracy, we provide the detailed specialty-specific revenue reports you need to lead informed conversations. Don't let outdated surveys or administrative opacity define your worth. Calculate your true economic value with the Empwr Index Report and enter your next renewal with the steady assurance of objective evidence. You've dedicated your career to clinical excellence; it's time your compensation reflected the full scope of your impact.
Frequently Asked Questions
What is the most common physician productivity metric used in 2026?
The Work Relative Value Unit (wRVU) remains the primary metric for measuring clinical output. While value based care is gaining traction, 55.0% of physicians still have a portion of their compensation tied directly to productivity. The wRVU system provides a standardized way for administrators to compare effort across different specialties and procedures, making it the dominant standard for 2026 contract structures.
How often do MGMA and SullivanCotter update their physician benchmarks?
These organizations typically release updated datasets on an annual basis. These reports are based on survey data collected from the previous year, which creates the "survey lag" mentioned in our analysis. Because of this cycle, the physician productivity benchmarks used for your 2026 negotiations are often reflecting clinical and economic realities from 2024 or 2025.
Can I negotiate my contract if my productivity is below the 50th percentile?
You absolutely can and should negotiate regardless of your percentile ranking. If your raw volume is below the median, you must pivot the conversation toward your contribution margin, patient complexity, or the downstream revenue you generate for the hospital. Demonstrating high clinical efficiency or specialized service offerings can justify a competitive salary even if your raw wRVU count is lower than the national average.
How do geographic adjustments affect national productivity benchmarks?
Geographic Practice Cost Indices (GPCI) modify Medicare payments to reflect local overhead, malpractice, and labor costs. This means that benchmarks in high cost urban centers are often adjusted upward. Administrators in these regions may expect higher productivity to offset the increased expense of maintaining a practice, while rural benchmarks might be lower due to different operational cost structures.
What is the difference between a wRVU and a total RVU in benchmarking?
A wRVU measures only the professional work and time a physician spends on a patient encounter. In contrast, a total RVU includes the wRVU plus practice expense and malpractice components. Benchmarking for individual physician performance focuses almost exclusively on wRVUs because they isolate your personal clinical effort from the facility's overhead and insurance costs.
Why should physicians care about contribution margin more than wRVUs?
Contribution margin represents the actual profit you generate for the health system after direct variable costs are subtracted from your total revenue. While wRVUs measure your effort, the contribution margin measures your economic sustainability. A physician with moderate wRVU output but high downstream referral value is often more fiscally important to a hospital than a high volume proceduralist with excessive overhead.
How do I access 2026 physician productivity data without a hospital subscription?
Individual clinicians rarely have direct access to the expensive, enterprise level subscriptions from MGMA or SullivanCotter. You can obtain objective data through independent platforms like the Empwr Index Report. These tools utilize publicly available CMS fee schedules and RAND pricing data to translate your clinical output into a specialty specific revenue analysis without requiring institutional access.
What happens if my productivity exceeds the 90th percentile of benchmarks?
Performing at the 90th percentile usually triggers significant productivity bonuses, but it also increases the risk of administrative audits. Hospitals often scrutinize high outliers to ensure coding compliance and documentation accuracy. If you are consistently performing at this level, you should use the data to negotiate for additional support staff or a more favorable conversion factor to prevent burnout.