

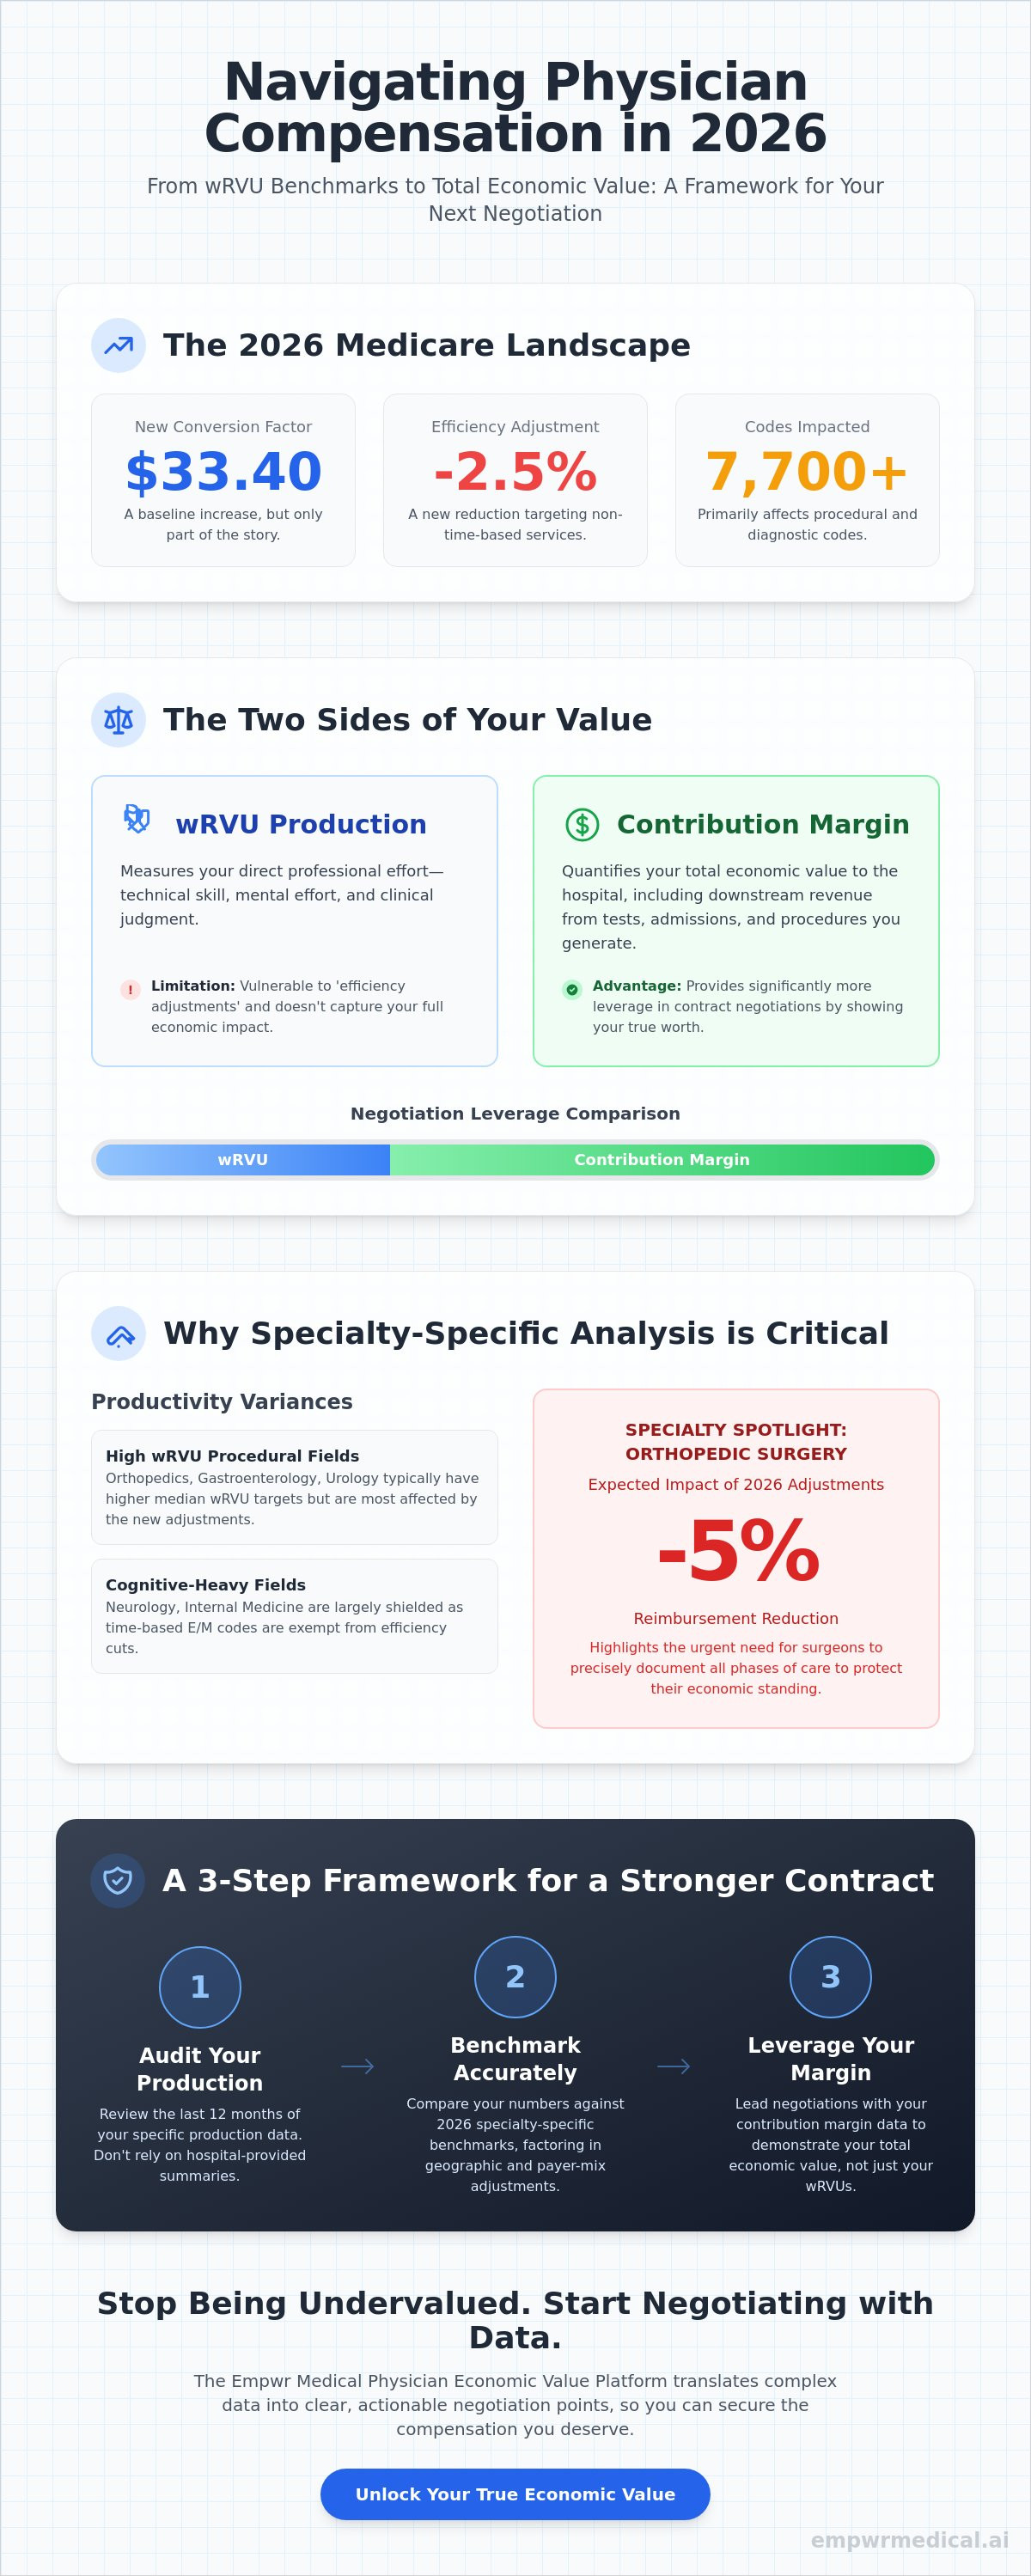
The 2026 Medicare conversion factor increase to $33.40 feels like progress, yet a new 2.5% efficiency adjustment now targets over 7,700 procedural and diagnostic codes. This shift means that a standard wRVU analysis by specialty is no longer sufficient to determine your professional worth in a complex market. You've likely felt the frustration of being undervalued by a hospital system that uses opaque metrics to justify stagnant compensation. It's difficult to negotiate when you don't have clarity on how your specific production translates into actual revenue for the organization.
We'll help you master the nuances of specialty-specific data to unlock your true economic leverage in contract negotiations. This article provides a clear framework to argue for higher compensation by examining the 2026 benchmarks and the critical difference between wRVU production and contribution margin. You'll move from feeling overlooked to leading informed, data-driven conversations about your value.
Key Takeaways
- Understand why a generic approach to productivity fails specialized physicians and how to apply a wRVU analysis by specialty to accurately reflect your technical effort.
- Compare your median production against 2026 benchmarks for high-impact fields like Cardiology and Orthopedics to identify your current market standing.
- Learn why contribution margin provides more leverage than wRVUs by quantifying the total economic value you bring to a hospital system.
- Follow a practical framework to audit your last 12 months of production and identify specialty-specific adjustments for your next contract negotiation.
- Discover how the Physician Economic Value Platform utilizes the Empwr Index to translate complex data into clear, actionable negotiation points.
The Role of wRVU Analysis in 2026 Physician Compensation
Modern physician compensation relies heavily on Relative Value Units (RVUs); they serve as the common currency for quantifying medical labor. Specifically, the work component (wRVU) measures the professional effort required to deliver a clinical service. In 2026, the Centers for Medicare & Medicaid Services (CMS) set the conversion factor for most clinicians at $33.40. This baseline is critical, but it's only the starting point for a deeper wRVU analysis by specialty. Understanding how physician relative value units explained the mechanics of your base salary is vital for any professional economic audit.
A "one-size-fits-all" approach to these metrics is inherently detrimental to specialized practitioners. The 2026 Medicare Physician Fee Schedule (PFS) introduced a new 2.5% efficiency adjustment that impacts approximately 7,700 CPT codes. This reduction primarily targets non-time-based services like procedures and diagnostic tests. Without a granular wRVU analysis by specialty, a proceduralist might see their production numbers drop despite maintaining the same clinical volume. This creates a disconnect between actual effort and reported productivity, often leading to undervalued contracts.
The Components of a Work Relative Value Unit
A wRVU isn't a random number. It's a calculated weight based on technical skill, mental effort, and clinical judgment. Stress and patient outcome risk also play significant roles in determining the value of specific codes. For instance, a high-complexity surgery involves greater technical intensity than a routine follow-up. However, time remains the most volatile variable. CMS frequently re-evaluates the "time" component of codes, and the 2026 efficiency adjustment assumes physicians have become more efficient at certain procedures. If your specialty's codes are being squeezed by these assumptions, your compensation model must reflect that reality.
Why Specialty-Specific Benchmarking is Non-Negotiable
Specialty-specific data is essential because of the massive variance in clinical workflows. Primary care specialties are largely shielded from the 2026 efficiency adjustment because time-based E/M codes are exempt. Conversely, surgical and diagnostic specialties face a landscape where "wRVU creep" and reimbursement reductions are real threats. Geographic adjustments also shift in 2026, meaning a surgeon in a high-cost urban center faces different economic pressures than one in a rural setting. Relying on aggregate national benchmarks ignores these nuances. You need data that reflects the specific intensity and economic environment of your practice to negotiate from a position of strength.
Comparative wRVU Benchmarks Across Medical Specialties
Comparing median production across disciplines reveals significant disparities in how clinical effort is rewarded. A rigorous wRVU analysis by specialty shows that procedural fields like Orthopedics, Gastroenterology, and Urology typically maintain higher median wRVU targets than cognitive-heavy disciplines like Neurology or Internal Medicine. However, raw production numbers don't tell the whole story. In private practice, the wRVU ceiling is often dictated by payer mix and operational efficiency, whereas academic environments may prioritize research or teaching, leading to lower clinical production benchmarks. For a deeper dive into these metrics, reviewing a specialty specific revenue analysis is a necessary step for any strategic negotiation.
Surgical vs. Non-Surgical Productivity Gaps
Surgical specialties face a unique challenge in 2026. The 2.5% efficiency adjustment implemented by CMS targets procedures, resulting in an expected 5% reimbursement reduction for orthopedic surgery. These cuts often mask the intense time commitment required for pre-operative and post-operative care, which isn't always captured in the global period payment. Cognitive E/M codes remain exempt from these efficiency reductions, slightly narrowing the productivity gap between surgical and non-surgical providers. This shift requires surgeons to be more precise in how they document every phase of care to maintain their economic standing.
High-Growth Specialties and wRVU Volatility
Gastroenterology and Cardiology continue to see high wRVU benchmarks, yet they also experience significant volatility. The integration of Advanced Practice Providers (APPs) has allowed physicians to offload lower-acuity tasks, effectively boosting physician wRVU totals. While this increases top-line production, it can also lead to a "treadmill effect" where the pressure to maintain high volume contributes to physician burnout. It's vital to assess whether your high production is sustainable or if it's eroding your professional well-being. To gain this level of insight, consider a professional Specialty-Specific Revenue Analysis to quantify your actual economic contribution.
The Limitation of Productivity Metrics: wRVU vs. Contribution Margin
wRVUs quantify your clinical volume, essentially measuring what you "do." In contrast, contribution margin measures what you "bring" to the institution. Contribution margin is the net revenue remaining after variable costs are deducted. A standard wRVU analysis by specialty often ignores the revenue variance between payers, which is a critical oversight in 2026. Commercial insurance "uplifts" frequently exceed Medicare rates by substantial margins, sometimes reaching 250% of the CMS baseline. Consequently, a physician with lower wRVU production but a high-value payer mix can be more profitable for a system than a high-volume peer. This paradox highlights why productivity metrics alone are an insufficient measure of your professional worth.
How Health Systems Use wRVUs to Obscure Profit
Hospital accounting is frequently a "black box" where administrators use wRVUs to simplify complex financial realities. This focus obscures the massive ancillary revenue generated through your orders for labs, imaging, and ambulatory surgery center (ASC) procedures. These downstream profits are rarely shared with the physician but are central to the hospital's bottom line. Knowing your physician fair market value data involves accounting for these facility-side gains that wRVU-only models intentionally ignore. By keeping the conversation focused on productivity, systems can avoid discussing the true margin you generate for the organization.
Transitioning from Productivity to Economic Value
Transitioning to a model of economic value requires more sophisticated data than what a hospital dashboard provides. The Physician Economic Value Platform introduces the Empwr Index to bridge this gap. By integrating RAND pricing data, which captures actual commercial payment rates rather than just CMS estimates, we move beyond the limitations of traditional models. A comprehensive wRVU analysis by specialty should identify hidden revenue streams like high-margin technical fees or care coordination bonuses. This data-driven approach shifts the negotiation from simple productivity to your total professional contribution, providing the clarity needed for a fair contract.
Leveraging Specialty-Specific Data for Contract Negotiations
Moving from data awareness to the bargaining table requires a methodical approach. You shouldn't walk into a meeting with just a feeling that you're underpaid. Instead, use a wRVU analysis by specialty to build a case that is impossible to ignore. This process begins with auditing your production against the 2026 CMS conversion factor of $33.40 and accounting for the new efficiency adjustments. Understanding how are physician salaries determined provides the necessary context to challenge traditional hospital models that rely on outdated benchmarks.
- Step 1: Audit your production. Compare your last 12 months of wRVUs against the 2026 median benchmarks for your specific sub-specialty.
- Step 2: Factor in adjustments. Identify how the 2.5% efficiency reduction impacts your most frequent CPT codes.
- Step 3: Define your floor. Calculate your contribution margin to determine the absolute minimum revenue you bring to the system.
- Step 4: Build your proposition. Synthesize your production, quality metrics, and downstream revenue into a single, cohesive value statement.
Addressing the "Fair Market Value" Trap
Health systems often use the 50th percentile as a hard cap for compensation, citing "Fair Market Value" (FMV) as a legal constraint. This is a common tactic to limit the earnings of high-performers. You can break this trap by highlighting clinical outcomes and specialty scarcity. If your region has a shortage of your specific expertise, the market value for your services naturally rises above the national median. Demand that the system views compensation through the lens of local reality rather than aggregate survey data. A granular wRVU analysis by specialty helps prove that your "value" isn't a fixed point, but a range influenced by your specific contributions.
Negotiating Beyond the wRVU Conversion Factor
Leverage doesn't always come from the base conversion rate. In 2026, "stackable" incentives are becoming the standard for sophisticated contracts. Push for quality bonuses, citizenship credits for committee work, and dedicated administrative time. These components ensure you're compensated for the work that wRVUs don't capture. By showing the system exactly how your presence drives ROI beyond the exam room, you create a sustainable partnership. To secure this level of detail for your next meeting, request a Specialty-Specific Revenue Analysis to quantify your full economic footprint.
Beyond the Benchmark: Using the Empwr Index for Total Economic Clarity
Information asymmetry remains the primary hurdle in modern physician negotiations. Hospital administrators possess sophisticated, real-time dashboards, while physicians often rely on fragmented anecdotes or static, year-old surveys. The Physician Economic Value Platform was built to equalize this dynamic. By utilizing a comprehensive wRVU analysis by specialty, we provide a decision-ready report that prepares you for your next annual review. This isn't a generic PDF. It's a personalized economic profile that reveals your true market standing through the lens of objective, verified data.
The core of our methodology is the Empwr Index. This proprietary metric synthesizes work relative value units with location-adjusted RAND data and specialty-specific nuances. While others provide broad national benchmarks, the Empwr Index accounts for the 2026 CMS efficiency adjustments and the specific commercial uplifts in your specific region. This granular detail ensures that your economic value is quantified with precision. It allows you to move beyond the limitations of simple productivity metrics and understand the true revenue you generate for the system.
The Advantage of Physician-Led Data
Presenting data created by physicians for physicians changes the tone of a professional negotiation. It carries a weight that third-party administrative reports lack because it respects the clinical realities of your workflow. We rely on authoritative sources like CMS and RAND to ensure every figure in your report is transparent and defensible. This shift in information access allows you to replace negotiation anxiety with quiet confidence. When you understand the mechanics of your contribution, you can lead the conversation rather than merely reacting to a hospital's standardized offer.
Quantifying Your Clinical Impact in 2026
A standard wRVU analysis by specialty is a necessary baseline, but it's only the starting point for a modern compensation strategy. To secure a contract that reflects your full professional worth, you must look at the intersection of production, payer mix, and institutional margin. We invite you to see your true value through a personalized economic profile on our platform. You can secure your physician economic value score today to begin the journey toward professional clarity. Getting started with the Empwr Medical platform is the first step in reclaiming your economic leverage and ensuring your compensation matches the reality of your clinical impact.
Securing Your Economic Future in 2026
The landscape of physician compensation is shifting under the weight of the 2026 Medicare efficiency adjustments and rising commercial benchmarks. You've seen that a basic wRVU analysis by specialty is merely the entry point for understanding your professional worth. True leverage exists at the intersection of your clinical production and the specific contribution margin you generate for your health system. By moving beyond static surveys and embracing granular, location-adjusted data, you transform from a passive participant into a strategic partner during contract discussions.
Our Physician Economic Value Platform is designed by physicians to provide the clarity you need for these critical conversations. We synthesize authoritative RAND and CMS data to ensure your value is quantified with absolute precision. Access your Empwr Index Report and see your true economic value to prepare for your next negotiation with quiet confidence. You've dedicated your career to clinical excellence; it's time your compensation reflects the full scope of your economic impact.
Frequently Asked Questions
What is the average wRVU conversion factor by specialty in 2026?
For calendar year 2026, the Medicare conversion factor is $33.40 for most clinicians, while qualifying alternative payment model participants receive $33.57. These figures serve as the baseline for government reimbursement. However, commercial conversion factors vary significantly, often ranging from 150% to 250% of these rates. A precise wRVU analysis by specialty must account for these commercial uplifts and regional market variations to determine your actual professional value.
How does CMS determine the annual changes to wRVU values?
CMS adjusts values through the Medicare Physician Fee Schedule based on recommendations from the AMA RVS Update Committee. These updates reflect changes in technical skill, mental effort, and the time required to perform specific services. The 2026 updates include a budget neutrality adjustment and a new efficiency reduction that impacts approximately 7,700 procedural codes. This ensures the total Medicare spend stays within statutory limits while reflecting modern clinical workflows.
Can I negotiate my wRVU conversion factor if I am in a high-demand specialty?
You can negotiate your conversion factor by demonstrating scarcity and high economic contribution to your health system. If your specialty has limited local supply or high patient demand, you possess significant leverage to move beyond the 50th percentile benchmarks. Providing data on your specific contribution margin and downstream revenue generation often justifies a conversion factor that exceeds standard hospital offers. Data is your most effective tool at the bargaining table.
What is the difference between total RVUs and work RVUs (wRVUs)?
Work RVUs measure the professional effort and technical skill of the physician, while Total RVUs include practice expense and malpractice components. Practice expense covers overhead costs like staff and supplies; malpractice expense accounts for professional liability premiums. Most physician compensation models focus exclusively on wRVUs because they represent your direct clinical productivity. Understanding this distinction is vital when reviewing how your hospital calculates your total production and incentive bonuses.
How do I calculate my own wRVU production if my hospital won’t share the data?
You can calculate your production by tracking your CPT codes and applying the weights found in the CMS Physician Fee Schedule lookup tool. Multiplying the volume of each code by its assigned weight provides a raw production total. Utilizing a professional wRVU analysis by specialty platform simplifies this process. It automatically adjusts for the 2026 efficiency factors and geographic multipliers that manual calculations often miss, providing a more accurate revenue picture.
Does a higher wRVU count always mean a higher salary?
A higher wRVU count does not automatically guarantee a higher salary because compensation depends on your specific contract structure. Some physicians operate on high base salaries with high production thresholds, while others use a pure "dollar-per-wRVU" model. If your conversion factor is low, you might produce more than a peer but earn less overall. It's critical to understand the intersection of your production volume and the rate paid per unit.
What happens to my wRVU credit if I use an Advanced Practice Provider (APP)?
Your wRVU credit depends on whether the APP's services are billed under your NPI or their own. When billing "incident to," the physician may receive full or partial credit for the work depending on the hospital’s internal policy. If the APP bills directly, they typically receive 85% of the physician fee schedule rate. In these cases, the physician may only receive a small oversight credit or no wRVUs at all for that encounter.
How often should I perform a specialty-specific wRVU analysis?
You should perform a specialty-specific analysis at least once per year or six months prior to a contract renewal. Frequent audits are necessary to account for annual CMS regulatory changes and shifts in regional market benchmarks. Regular reviews ensure you identify productivity trends early. This allows you to address potential undervaluation or "wRVU creep" before it impacts your long-term professional earnings or leads to avoidable burnout.