

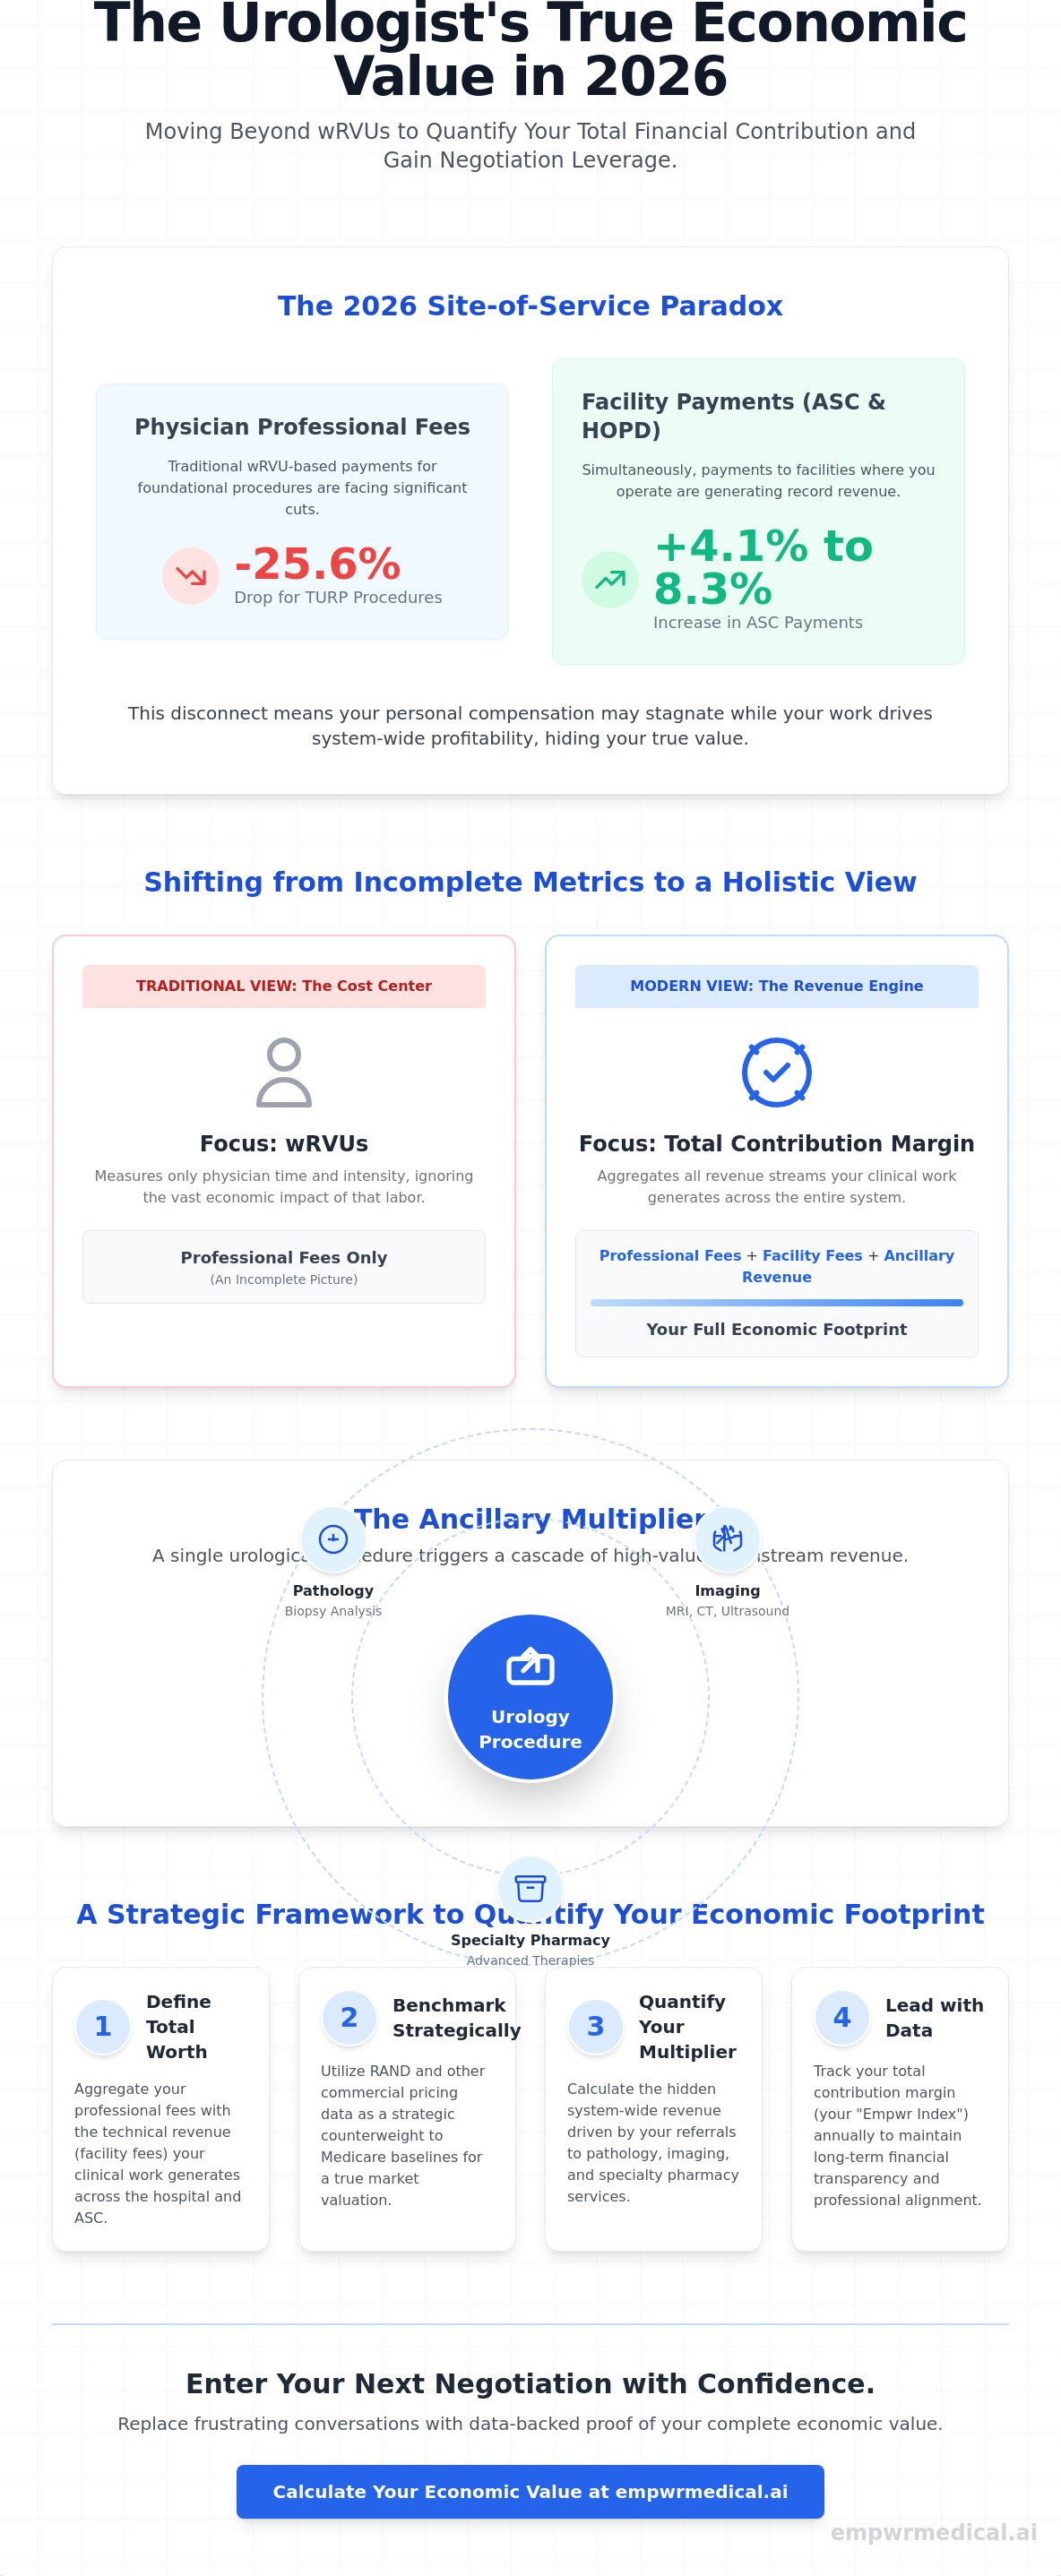
While the 2026 Medicare conversion factor rose by 3.26%, professional fees for foundational procedures like TURP have plummeted by 25.6% due to new CMS efficiency adjustments. This creates a stark site-of-service paradox where your clinical work generates record facility payments in ASCs and HOPDs, yet your personal urology physician economic value appears to stagnate under traditional wRVU models. It's a frustrating reality that leaves many high-performing surgeons feeling undervalued during contract renewals because the full scope of their financial contribution remains hidden.
You likely recognize that your worth to a health system extends far beyond your surgical volume, yet tracking the complexity of downstream revenue from labs and imaging remains elusive. This article provides a clear framework to quantify your total contribution margin, offering the data-backed leverage you need for upcoming negotiations. We'll explore how the 2026 RAND data and the shift to bundled CPT codes for prostate biopsies are redefining physician valuation. By moving past simple productivity metrics, you can enter your next meeting with the quiet confidence that only objective, specialty-specific financial evidence provides.
Key Takeaways
- Learn to define your total worth by aggregating professional fees with the technical revenue your clinical work generates across the hospital and ASC care continuum.
- Understand how to utilize RAND pricing data as a strategic counterweight to Medicare baselines, establishing a more accurate market valuation for your next contract renewal.
- Quantify the "Ancillary Multiplier" to reveal the hidden system-wide revenue your practice drives through high-impact services like pathology, imaging, and specialty pharmacy.
- Follow a structured, two-step methodology to calculate your urology physician economic value using updated 2026 CMS conversion factors and location-adjusted benchmarks.
- Transition into the role of a clinical enterprise leader by tracking your Empwr Index score annually to maintain long-term financial transparency and professional alignment.
The 2026 Landscape: Defining Urology Physician Economic Value
Defining urology physician economic value requires a fundamental shift from viewing a surgeon as a cost center to recognizing them as a primary revenue engine. Historically, valuation focused almost exclusively on professional fees, which only account for the physician's direct labor. In 2026, a true economic profile must account for the sum of professional fees and the technical revenue generated through facility fees and ancillary services. This holistic view aligns with the principles of health economics, where efficiency and total output dictate the long-term sustainability of the practice model. As the industry moves toward value-based care, granular data becomes the only reliable bridge between clinical performance and financial viability.
The transition to value-based models has created an urgent need for data that tracks the entire care continuum. Administrators often view compensation through the lens of institutional overhead, while physicians focus on clinical productivity. This tension is best resolved through objective evidence. Modern economic profiling identifies how a single urologist's surgical schedule drives the financial health of the entire system. Key stakeholders in this process include:
- Physicians: Seeking fair market compensation that reflects their total contribution margin.
- Health System Administrators: Looking to optimize service line profitability and manage downstream revenue.
- Private Equity Partners: Focused on EBITDA growth and the scalability of ancillary revenue streams.
Beyond wRVUs: Why Volume Metrics are Incomplete
Work Relative Value Units (wRVUs) measure the time and intensity of a physician's labor, but they fail to capture the downstream economic impact of that labor. For urologists, a significant portion of the value they bring to a health system resides in the technical component of procedures performed in Ambulatory Surgical Centers (ASCs) or hospital outpatient departments. Relying solely on wRVUs ignores the revenue generated by pathology labs, imaging suites, and specialty pharmacies. To address this, high-level professionals are adopting specialty-specific revenue analysis. This methodology translates clinical effort into a comprehensive contribution margin, providing a clearer picture for both the physician and the hospital leadership.
The 2026 Regulatory Impact on Urology Reimbursement
The 2026 Medicare Physician Fee Schedule has introduced structural shifts that complicate traditional valuation. While the non-QPP conversion factor increased to $33.4009, CMS finalized a -2.5% efficiency adjustment to work RVUs for most non-time-based services. This creates a disconnect where your clinical effort remains the same, yet the professional fee portion of your urology physician economic value is under pressure. Simultaneously, site-of-service shifts are accelerating. While professional fees for facility-based procedures have seen cuts, ASC payments for urology procedures increased by 4.1% to 8.3%. Understanding these location-adjusted nuances is essential. Without accounting for geographic adjustments and the current site-of-service paradox, a urologist's true economic footprint remains obscured by national averages that don't reflect local operational realities.
Decoding Revenue Streams: From CMS Fee Schedules to RAND Benchmarking
CMS data serves as the foundational floor for calculating professional fees, but it's a floor that's increasingly unstable. For 2026, the Medicare Physician Fee Schedule (PFS) conversion factor sits at $33.4009 for non-participants in alternative payment models. While this represents a nominal increase from 2025, the finalized -2.5% efficiency adjustment for non-time-based services means that the actual reimbursement for many urological procedures has contracted. To understand your true urology physician economic value, you must look beyond these government-set rates and account for the total revenue your clinical work triggers across the entire system.
The landscape of physician fair market value data has shifted significantly this year. We're seeing a move away from simple national averages toward a more rigorous methodology that translates clinical volume into commercial revenue estimates. This transition requires mapping your specific CPT code frequency against commercial payer contracts. Because private insurers often pay a significant premium over Medicare, relying solely on CMS benchmarks during a contract renewal will almost certainly result in an undervaluation of your professional contribution.
Commercial Multipliers and the RAND Advantage
Commercial payers don't operate in a vacuum; they typically peg their rates to a multiple of the current CMS fee schedule. However, the exact multiplier is rarely transparent during hospital-employed contract negotiations. RAND pricing data acts as a critical counterweight here. It reveals the "hidden" commercial revenue urologists generate by providing benchmarks for what private insurers actually pay for the same services in your specific geography. Commercial-to-Medicare payment ratios vary widely by specialty, with procedurally intensive fields like urology often seeing the highest variance between public and private reimbursement levels. Using this data allows you to quantify the gap between your Medicare-based productivity and the actual dollars collected by the facility.
Specialty-Specific Nuance in Urology Revenue
The economic profile of a general urologist differs vastly from a specialist in urologic oncology or robotics. High-frequency codes, such as cystoscopy or the newly bundled prostate biopsy family (CPT 55707-55715), provide the baseline revenue for most practices. However, robotic-assisted procedures often carry higher technical valuations and different facility fee structures. Understanding how physician relative value units explained the relationship between work effort and revenue capture is vital for these specialists. For instance, the 2026 bundling of imaging guidance with prostate biopsies fundamentally changes how revenue is attributed to the physician versus the facility. To gain full clarity on these complex streams, it's beneficial to utilize a specialty-specific revenue analysis that accounts for your unique procedural mix and local market dynamics.
The Ancillary Multiplier: Quantifying System-Wide Contribution Margin
The "Ancillary Multiplier" represents the total revenue a physician triggers outside of their direct professional work. In urology, this multiplier is exceptionally high. Unlike many other specialties, urology is uniquely integrated with pathology, advanced imaging, and specialty pharmacy. To calculate your true urology physician economic value, you must shift your focus from gross production to contribution margin. This metric accounts for both direct revenue and the variable costs associated with delivering care, such as surgical supplies and clinical staff. While the cardiologist economic value often relies on high-volume diagnostic testing, urologists drive value through a more intensive mix of procedural interventions and long-term pharmaceutical management that creates a deeper economic footprint.
A rigorous analysis of contribution margin reveals hidden truths about practice profitability. It moves beyond the top-line revenue to show how much "profit" remains to cover fixed costs and hospital overhead. This data is the steady assurance needed for fair negotiations. Administrators often use these margins to determine the strategic importance of a service line, yet physicians rarely have access to the same granular data. By quantifying these streams, you transform from a clinical provider into a strategic partner who understands the fiscal realities of the health system.
Technical Revenue Capture: Labs, Imaging, and Pharmacy
Urologists frequently manage their own in-house pathology and specialized urological labs, which is a major driver of system-wide profitability. The economic value of advanced imaging, such as MRI-fusion biopsies, extends far beyond the professional fee; it includes the facility payment and the subsequent pathology processing. Additionally, the role of specialty pharmacy and in-office dispensing has become a cornerstone of urological valuations in 2026. Managing oral oncology medications or advanced bladder cancer therapies creates a recurring revenue stream that traditional wRVU models completely ignore. These ancillaries often represent the difference between a service line that merely breaks even and one that thrives.
Downstream Impact: ASCs and Hospital Admissions
The site-of-service paradox becomes even clearer when examining Ambulatory Surgical Centers (ASCs). When procedures move to physician-owned or joint-ventured ASCs, the contribution margin shift is massive. While Medicare professional fees have seen pressure, ASC payments for urology procedures increased by 4.1% to 8.3% this year. This shift captures technical revenue that would otherwise be lost to the hospital outpatient department. Urological surgery also creates a "halo effect" on hospital inpatient admissions for complex cases. Much like the orthopedic surgeon contribution margin, which serves as a peer benchmark for surgical downstream revenue, urology drives significant facility profitability through high-intensity surgical interventions and subsequent post-operative care.
Strategic Profiling: How to Calculate Your Urological Economic Footprint
Quantifying your clinical impact requires a transition from retrospective review to prospective modeling. To establish a baseline for your urology physician economic value, you must follow a structured methodology that accounts for the full spectrum of revenue capture. This process moves beyond the limitations of internal hospital dashboards by incorporating external market benchmarks and site-of-service nuances. By following these five steps, you can translate your clinical log into a transparent financial profile:
- Step 1: Aggregate your 12-month CPT code frequency and volume to identify your core procedural mix.
- Step 2: Apply the 2026 CMS conversion factor of $33.4009 and incorporate your specific Geographic Practice Cost Index (GPCI) adjustments.
- Step 3: Overlay commercial multiples using RAND data to estimate the premium private payers contribute over Medicare rates.
- Step 4: Estimate ancillary technical revenue, including in-office dispensing, lithotripsy, and pathology, based on local facility fee schedules.
- Step 5: Synthesize these data points into a single physician economic value score to benchmark your performance against national specialty standards.
Identifying High-Value Urological Service Lines
Not all clinical hours carry the same economic weight. In 2026, the viability of BPH treatments like UroLift and Rezum depends heavily on your ability to capture the technical component within an office or ASC setting. While these are high-volume drivers, robotic-assisted laparoscopic prostatectomies (RALP) remain high-margin interventions for the health system due to the significant facility fees and downstream oncology care they trigger. Balancing your clinical time requires a precise understanding of which service lines optimize your contribution margin. High-performing practices often prioritize procedures that utilize specialized equipment, as these drive the technical revenue that traditional wRVU metrics ignore.
Overcoming Data Asymmetry in Contract Discussions
Data asymmetry occurs when a hospital administration possesses comprehensive revenue data while the physician only sees their individual productivity reports. This gap often leads to an undervaluation of the physician's role in system-wide profitability. Entering a physician contract negotiation without independent data is a strategic disadvantage. Utilizing an external valuation provides the steady assurance of methodology, allowing you to discuss your worth based on objective evidence rather than anecdotal clinical effort. Independent data serves as a bridge of clarity that builds objective trust and facilitates more equitable professional alignment. To ensure your contract reflects your true impact, you should secure a Specialty-Specific Revenue Analysis before your next renewal cycle.
Navigating the Future with Specialty-Specific Revenue Analysis
As the healthcare environment becomes increasingly consolidated, urologists must adopt the mindset of a CEO over their own clinical enterprise. Clinical excellence remains the foundation of your practice, but economic literacy is now the primary safeguard for your professional autonomy. Relying on a hospital's internal reporting often results in a narrow view of your productivity that ignores the massive technical revenue you generate. To maintain a sustainable career and prevent the burnout associated with constant "productivity" pressure, you need a transparent understanding of your urology physician economic value. This clarity allows you to transition from a passive participant in a system to a data-driven advocate for your own worth.
The prerequisite for professional autonomy in 2026 is the ability to quantify your impact with precision. When you understand the specific contribution margin of your surgical and ancillary lines, you gain the leverage to dictate terms that reflect your true system-wide importance. Moving beyond the wRVU treadmill requires a commitment to annual economic profiling. This ensures that as CMS regulations and commercial multipliers shift, your compensation remains aligned with the actual revenue you trigger.
Leveraging the Empwr Index for Urological Strategy
The Empwr Index Report serves as a critical tool for simplifying this complexity. It translates exhaustive CPT data into a single, actionable score that reflects your total economic footprint. Within a group practice, this score is invaluable for ensuring internal equity and making informed decisions about resource allocation. For example, if the data shows a high-margin opportunity in office-based lithotripsy or specialized lab services, the index provides the evidence needed to justify the investment. Because the Physician Economic Value Platform updates valuations in real-time as CMS adjusts conversion factors and efficiency weights, your strategy stays grounded in the most current regulatory realities.
From Perception to Data-Backed Advocacy
Presenting your value to hospital C-suite executives requires a shift in language. Instead of asking for a raise based on clinical effort, you should be proposing a value-aligned contract supported by objective evidence. When you walk into a meeting with a Specialty-Specific Revenue Analysis, you're presenting a business case that administrators respect. You can demonstrate exactly how your practice drives facility profitability through ASC procedures and ancillary capture. This transition from emotional appeals to data-backed advocacy builds a bridge of clarity between clinical work and financial results. It empowers you to secure the resources and compensation you deserve while ensuring your practice remains a vital, recognized pillar of the health system's economic health.
Securing Your Professional Standing Through Economic Clarity
The 2026 healthcare landscape demands a departure from the antiquated reliance on wRVU production as the sole measure of a surgeon's worth. By quantifying the technical revenue from ASCs, labs, and specialty pharmacy, you've seen how a comprehensive contribution margin analysis provides a more accurate reflection of your urology physician economic value. This data-driven approach moves beyond hospital-held metrics, offering the transparency needed for balanced professional alignment and long-term career sustainability.
Entering your next contract renewal with the steady assurance of objective benchmarks is the most effective way to ensure your compensation reflects your true system-wide impact. Our physician-founded methodology utilizes verified 2026 CMS and RAND data to translate your clinical effort into a precise financial profile. This provides you with an objective Empwr Index score that serves as powerful leverage during high-level negotiations, replacing clinical perception with financial reality.
Get your personalized Empwr Index report to quantify your true economic value.
Take the next step toward professional autonomy with the clarity that only specialty-specific analytics can provide. Your clinical expertise is a vital asset; it's time your contract recognized its full economic footprint.
Frequently Asked Questions
What is the average contribution margin for a urologist in 2026?
The average contribution margin for a urologist is a calculation of total system revenue minus variable clinical and surgical expenses. In 2026, high-performing urologists often generate system-wide margins that far exceed their professional fee production because of their heavy reliance on ancillaries. Tracking this specific metric is essential for understanding your true urology physician economic value beyond simple base salary benchmarks.
How does the site-of-service affect urology physician economic value?
Site-of-service shifts fundamentally alter your economic footprint by changing how Medicare and private payers distribute technical fees. While the 2026 Medicare Physician Fee Schedule reduced facility-based professional fees for procedures like TURP by 25.6%, ASC payments for those same services rose by up to 8.3%. Performing procedures in an ASC or office-based setting often captures significantly more technical revenue for the practice or health system than the hospital outpatient department.
Why should urologists use RAND data instead of just MGMA surveys?
RAND data provides a critical counterweight to survey-based benchmarks by revealing actual commercial-to-Medicare payment ratios in specific markets. While MGMA surveys rely on self-reported data that can be retrospective, RAND pricing data reflects real-world claims. This allow you to quantify the "hidden" commercial revenue you generate, which is often a significant multiple of the standard CMS rate.
What are the highest-value CPT codes in urology for 2026?
The highest-value CPT codes for 2026 include the new Category I code for Aquablation (52597) and the restructured prostate biopsy family (55707 to 55715). These codes are significant because they bundle previously separate services or establish new standards for procedural reimbursement. High-margin service lines often focus on these complex interventions that drive both professional fees and substantial technical facility revenue.
How do geographic adjustments impact my economic value score?
Geographic adjustments ensure that your economic value score reflects the local cost of living and practice expenses in your specific region. CMS adjusts the work, practice expense, and malpractice components of each RVU based on these indices. A urologist in a high-cost urban center will have a different baseline valuation than one in a rural area, even if their clinical volume is identical.
Can I calculate my economic value if I am a hospital employee?
You can calculate your economic value as a hospital employee by aggregating your 12-month CPT frequency and applying current market benchmarks. Even if you don't have direct access to the hospital’s internal collections data, knowing your procedural volume allows you to estimate the total contribution margin you bring to the system. This independent data provides essential leverage during contract negotiations with administration.
What is the difference between professional fees and technical revenue in urology?
Professional fees represent the reimbursement for your direct clinical labor, while technical revenue covers the use of the facility, equipment, and ancillary staff. In urology, the technical component from labs, imaging, and ASC fees often represents a larger portion of the total economic impact than the professional fee alone. Accurate valuation requires a synthesis of both streams to define your total urology physician economic value.
How often should I update my urology economic value profile?
You should update your economic value profile at least once per year to account for annual CMS fee schedule revisions and shifting commercial multipliers. The 2026 updates, including the new efficiency adjustments and CPT code changes, demonstrate how quickly valuation baselines can move. Maintaining an annual cadence ensures your professional strategy remains aligned with current market realities and regulatory standards.