

While the average gastroenterologist generates approximately $3.5 million in net annual hospital revenue, most practitioners find their compensation tied to opaque wRVU models that fail to capture their full economic impact. This gap between clinical throughput and realized gastroenterology physician revenue often leaves high-volume specialists feeling undervalued. You likely recognize that your value extends far beyond a simple productivity metric, yet the data to prove it remains locked behind institutional silos.
It's frustrating to manage an increasing procedural volume and the 2.5% Medicare efficiency adjustments while lacking a clear picture of the actual profit you drive. We'll show you how to translate your clinical workload into a data-backed revenue profile that empowers your professional strategy. This guide explores the mechanics of site-of-service efficiency, the impact of new 2026 CPT codes, and the methodology for quantifying your contribution margin with clinical precision.
Key Takeaways
- Define your total economic output by shifting focus from static salary surveys to comprehensive clinical and procedural throughput.
- Analyze how 2026 reimbursement updates and procedural volume directly influence gastroenterology physician revenue across different practice settings.
- Discover why calculating your contribution margin provides a more authoritative benchmark for your professional value than standard wRVU models.
- Evaluate how private equity consolidation and the transition toward value-based care are fundamentally reshaping gastroenterology practice valuations.
- Learn to leverage location-adjusted data and specialty-specific insights to transform complex institutional metrics into a powerful advocacy tool for your career.
Beyond the Salary: Understanding Gastroenterology Physician Revenue in 2026
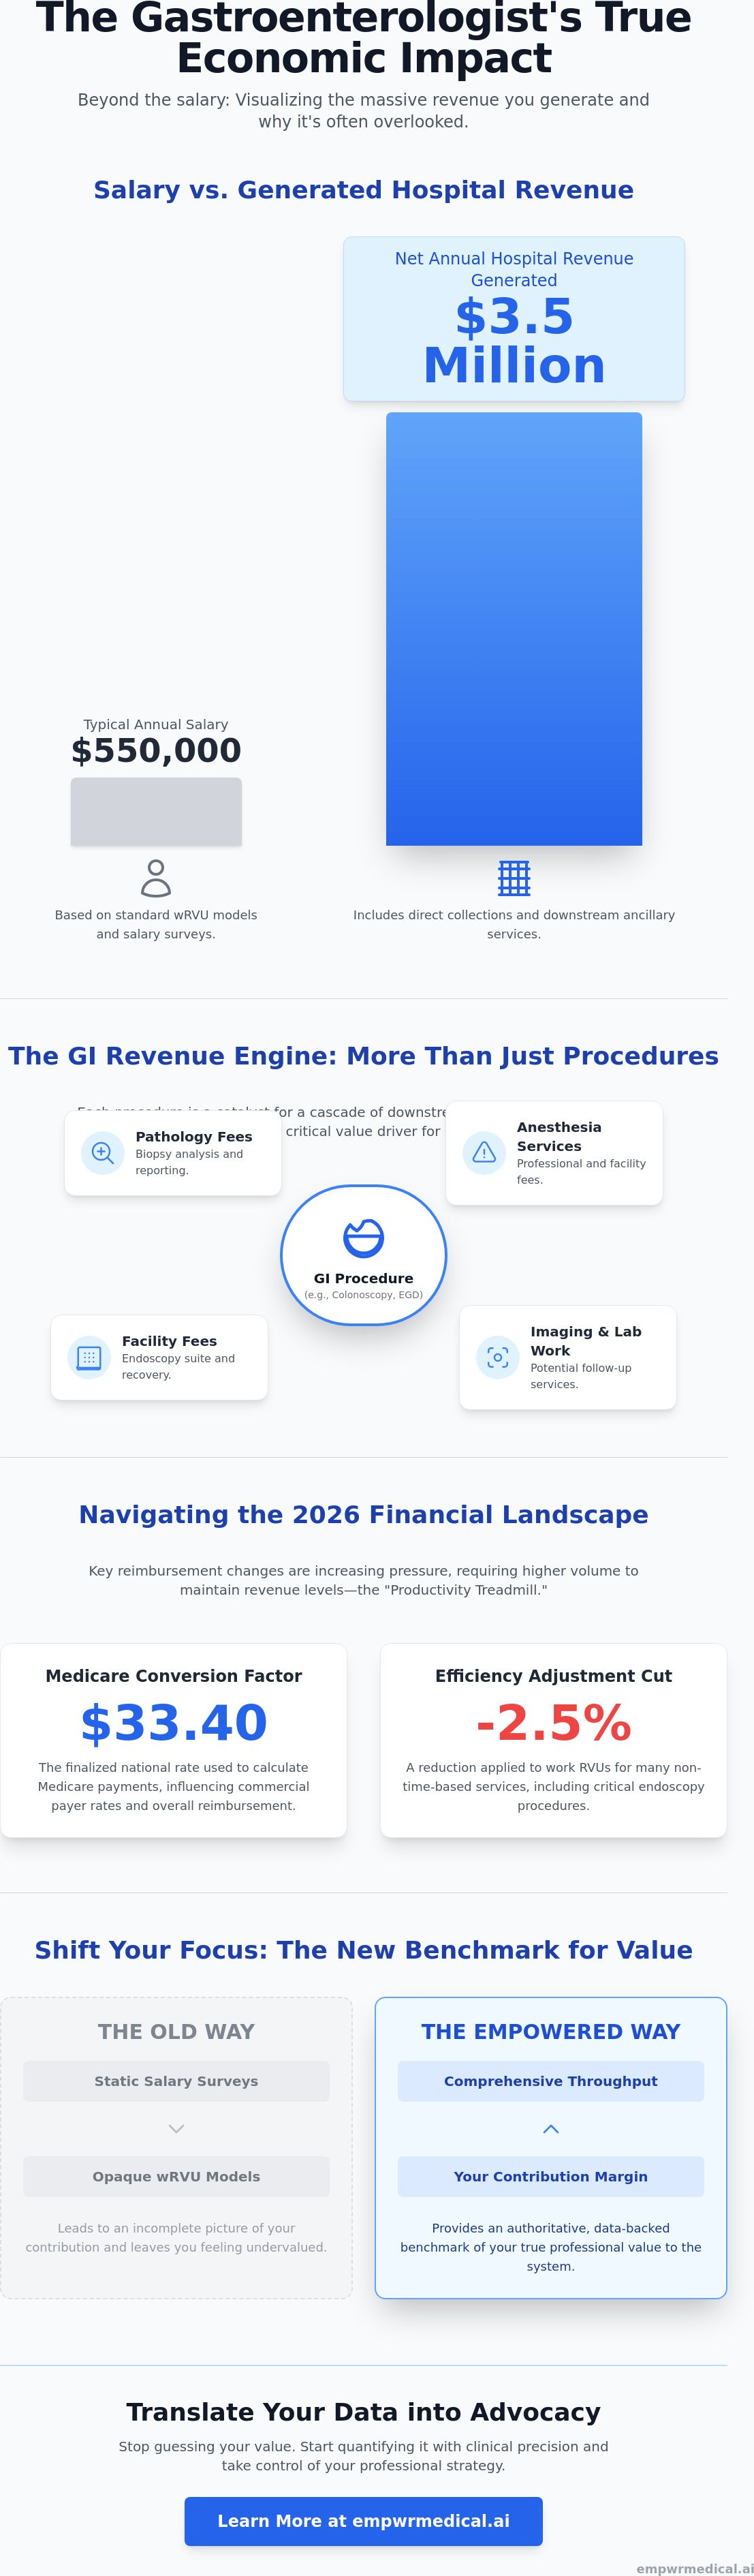
Gastroenterology physician revenue represents the total economic output generated by your clinical expertise and procedural throughput. It's a figure that far exceeds the standard salary benchmarks found in traditional recruitment surveys. While a typical salary might hover around $550,000, the net annual hospital revenue generated by a single gastroenterologist is now approximately $3.5 million. This disparity exists because your value isn't just a reflection of your paycheck; it's the sum of direct collections and the vast ecosystem of ancillary services your work triggers.
In 2026, the market landscape is defined by increased reimbursement pressure and clinical consolidation. With the Medicare conversion factor finalized at $33.40 and a 2.5% efficiency adjustment applied to many endoscopy services, the gap between "gross charges" and "net collections" has widened. Gross charges represent the theoretical sticker price of your services, whereas net collections are the actual dollars received after payer contracts and adjustments. To truly understand your worth, you must look past these figures toward your total economic value, which accounts for the strategic role you play in the healthcare system.
The specialty of Gastroenterology remains a primary engine for health systems because it combines high-volume screening with complex interventional work. This dual nature ensures a steady stream of patients while providing the high-margin procedures that support broader institutional operations.
The Shift from Cost Centers to Value Drivers
Hospitals categorize departments into cost centers or value drivers. Cognitive-heavy specialties often struggle to prove their financial footprint, but GI is viewed as a critical revenue engine. This status is largely due to downstream revenue. Every colonoscopy or EGD you perform generates secondary income through pathology fees, anesthesia services, and potentially imaging or laboratory work. Understanding these connections is a fundamental step in quantifying physician value. When you account for these "hidden" revenue streams, your role shifts from a service provider to a strategic asset whose presence stabilizes the hospital's bottom line.
Revenue vs. Compensation: The Transparency Gap
Your paycheck rarely reflects the full scope of the value you create. This transparency gap occurs because institutional billing systems are designed to track "units of work" rather than the total economic impact of a specialist. Administrative overhead, inefficient billing practices, and hospital margin requirements often obscure the direct link between your effort and the revenue collected. In the 2026 fiscal environment, physician economic value is defined as the total net revenue generated across all sites of service, including ancillary downstream income, adjusted for the finalized $33.40 Medicare conversion factor and specific procedural efficiency cuts.
Mechanics of GI Revenue: Procedural Volume and Clinical Workload
The primary engine of gastroenterology physician revenue is the strategic mix of screening, diagnostic, and interventional procedures. While screening colonoscopies provide a high-volume, predictable foundation, interventional work often carries higher technical complexity and reimbursement. In 2026, the finalized Medicare conversion factor of $33.40, combined with a 2.5% efficiency adjustment cut to work RVUs for non-time-based services like endoscopy, creates a productivity treadmill. You must now perform more cases to maintain the same revenue levels, making the distinction between clinical workload and economic output more critical than ever. Understanding Physician Compensation Models is essential for interpreting how these clinical inputs translate into professional income.
Advanced procedures such as ERCP and EUS act as significant revenue multipliers. These services don't just offer higher work RVUs; they command substantial facility fees and drive downstream ancillary revenue through pathology and anesthesia. A balanced clinical workload requires a precise calibration between outpatient clinic visits, which often utilize the G2211 complexity add-on code for ongoing care, and endoscopy suite time. High-margin interventional work compensates for the lower-reimbursement cognitive time spent managing chronic conditions like IBD or chronic IBS abdominal pain, especially with the introduction of new 2026 codes like 64567 for nerve field stimulators.
The Impact of Site-of-Service on Revenue Potential
The location where you perform procedures fundamentally alters your total economic footprint. Hospital Outpatient Departments (HOPD) typically command higher facility fees, but these dollars rarely flow back to the physician. In contrast, Ambulatory Surgery Centers (ASC) offer a more efficient environment with lower overhead. For high-volume proceduralists, ASC equity is a strategic advantage, often allowing for 30% to 50% higher total earnings compared to hospital-employed counterparts. A specialty-specific revenue analysis can clarify how your procedural mix and site-of-service choices compare to regional benchmarks.
Subspecialty Nuances in Gastroenterology Revenue
General GI revenue profiles differ significantly from those of Hepatology or IBD specialists, who may rely more on complex medical management and infusion services. While multi-specialty groups often benchmark GI against cardiologist economic value, the high procedural throughput of a GI suite often creates a distinct revenue profile rooted in technical efficiency. Advanced endoscopy fellowship training further elevates these benchmarks, as the ability to perform complex tertiary care procedures like transoral endoscopic sleeve gastroplasty (CPT 43889) secures a premium in the 2026 market.
Salary vs. Economic Value: Why Contribution Margin is the Real Benchmark
Traditional gastroenterology physician compensation data often focuses on median salaries, which are inherently backward-looking. These figures describe what you were paid in the past, not the value you are currently generating. To accurately measure gastroenterology physician revenue, you must shift your focus to the contribution margin. This metric represents the net revenue remaining after variable clinical costs, such as medical supplies, sedation, and direct procedural staffing, are subtracted from your total collections. It provides a real-time reflection of your profitability rather than a historical average based on peer surveys.
Many physicians hesitate to utilize this metric because they feel they lack access to internal practice expense data. However, institutional transparency isn't a prerequisite for economic clarity. By using specialty-specific benchmarks and regional cost models, you can estimate your margin with high precision. This data-driven approach is far more authoritative than physician relative value units explained in standard employment contracts. While wRVUs measure your effort, contribution margin measures the actual financial health you bring to the organization.
Moving Beyond the wRVU Trap
The wRVU model is a productivity metric, not a value metric. It ignores the site-of-service advantages and downstream revenue streams that define the modern GI suite. The Empwr Index solves this by integrating CMS and RAND data to reveal the true profitability of your specific clinical volume. For instance, comparing your results to an orthopedic surgeon contribution margin reveals how different specialties drive institutional growth through distinct cost-to-revenue ratios. This cross-specialty perspective helps you articulate your value in multi-specialty group negotiations where GI often serves as the primary engine of liquidity.
Calculating Your Individual Economic Impact
Estimating your impact requires a structured framework that accounts for your procedural mix and the Geographic Practice Cost Index (GPCI). These geographic adjustments ensure your revenue profile reflects local costs and practice expenses in 2026. By multiplying your procedural volume by location-adjusted reimbursement rates and subtracting estimated variable costs, you create a decision-ready profile of your worth. In the context of 2026 GI practice, contribution margin is the definitive measure of the liquid capital a physician generates for their facility after accounting for the direct costs of procedural care.
Market Trends Influencing Gastroenterology Revenue in 2026
The 2026 fiscal year introduces specific regulatory shifts that directly impact gastroenterology physician revenue. CMS has finalized the Medicare conversion factor at $33.40, but the 2.5% efficiency adjustment cut to work RVUs for endoscopic procedures remains a primary concern for high-volume proceduralists. This regulatory pressure is accelerating the adoption of AI-assisted colonoscopy. While AI tools are often marketed for clinical precision, their true economic value lies in improving procedural efficiency and adenoma detection rates, which are increasingly tied to performance-based incentives. Payers are transitioning toward value-based care models, utilizing bundled payments for chronic conditions like inflammatory bowel disease (IBD). This shift requires a move away from pure fee-for-service thinking toward longitudinal patient management.
New CPT codes for 2026 also provide fresh opportunities for revenue diversification. Code 43889 for transoral endoscopic sleeve gastroplasty (ESG) and 64567 for periauricular nerve field stimulators allow specialists to capture value in emerging therapeutic areas. Additionally, the introduction of remote therapeutic monitoring codes, such as 98979, enables practices to bill for the ongoing management of complex patients outside the traditional office visit. These updates require a methodical approach to documentation to ensure that the increased clinical complexity is accurately reflected in net collections.
Consolidation and the Power of Large GI Groups
Private equity investment continues to reshape the landscape, with approximately 14% of all GI clinical sites now affiliated with PE-backed platforms. Between 2013 and 2023, firms acquired 114 outpatient practices, signaling a massive consolidation of 1,169 clinical sites. These mega-groups possess significant negotiating leverage with commercial insurers, often securing rates that independent practices cannot access. However, this stability often comes at the cost of clinical autonomy. You can observe similar patterns in urology physician economic value trends, where consolidation has led to a standardized, data-driven approach to revenue management.
The Role of Ancillary Revenue Streams
Ancillary services are no longer secondary; they are foundational to the modern GI business model. Pathology labs, anesthesia services, and infusion centers provide high-margin revenue that offsets the declining reimbursement for standard screenings. Physician ownership in these services creates a robust economic buffer against CMS cuts, though it requires careful navigation of regulatory statutes. When you are preparing for physician contract negotiation, accounting for these downstream streams is essential. You aren't just negotiating for a base salary; you're negotiating for a share of the total ecosystem you sustain.
To understand how these trends affect your specific market position, you can access a specialty-specific revenue analysis that quantifies your value in real-time.
Translating Data into Advocacy: The Empwr Index for GI
The complexity of gastroenterology physician revenue requires a move away from anecdotal evidence toward rigorous economic modeling. The Physician Economic Value Platform addresses this need by synthesizing objective datasets from CMS and RAND to provide specialty-specific insights. By utilizing location-adjusted data, the platform accounts for regional cost variances and the specific GPCI of your practice area. This level of granularity ensures that your revenue profile isn't a broad estimation but a precise reflection of your actual economic footprint. It translates your procedural volume into a clear dollar value that reflects the current 2026 reimbursement environment, including the impact of the finalized $33.40 conversion factor.
Physician-led data is the only effective counter-measure to hospital-biased financial reporting. Administrators often rely on proprietary internal metrics that emphasize overhead and productivity quotas while ignoring the downstream value you generate through pathology, imaging, and anesthesia. The Empwr Index Report provides the transparency needed to lead informed conversations, shifting the power dynamic from institutional compliance to professional partnership. It empowers you to speak the language of the C-suite while maintaining your clinical integrity, ensuring that the financial discussion is grounded in the reality of your workload rather than institutional averages.
Preparing for Your Next Review
When approaching a contract renewal, your revenue analysis serves as a foundational tool for advocacy. Start by identifying your total contribution margin and comparing it against physician fair market value data to identify any discrepancies in your current compensation. This data acts as a shield against low-ball offers that rely on outdated salary surveys or opaque wRVU targets. Entering negotiations with "quiet confidence" allows you to present your value as an objective fact. You aren't making an emotional request; you're presenting a data-backed business case for your professional standing.
Strategic Planning for Your GI Career
Economic clarity is essential when deciding between hospital employment, PE-backed platforms, or private practice. Revenue data helps you identify undervalued clinical activities, such as advanced anorectal function studies (CPT 91124) or remote therapeutic monitoring, which may offer higher margins than traditional office visits. Understanding these nuances allows you to optimize your clinical schedule for both professional satisfaction and financial stability. You don't have to guess about your worth in the 2026 market. Take the first step toward professional transparency and generate your Empwr Index Report today.
Mastering the Economics of Your 2026 GI Practice
Quantifying your professional contribution requires a departure from backward-looking salary surveys. As discussed, mastering gastroenterology physician revenue in 2026 involves more than tracking wRVUs; it requires a deep understanding of contribution margins, site-of-service efficiency, and the downstream value of ancillary services. By accounting for the finalized Medicare conversion factor and specific procedural efficiency adjustments, you can transform complex clinical throughput into a clear, strategic asset.
The Physician Economic Value Platform provides the methodology needed to lead informed conversations with institutional leadership. This physician-founded platform utilizes authoritative CMS and RAND data to deliver specialty-specific revenue modeling tailored to your unique practice environment. You don't have to navigate upcoming reviews with incomplete data. Calculate your true economic value with the Empwr Index Report to ensure your compensation reflects the full scope of the financial engine you sustain.
Clarity is the foundation of professional empowerment. Armed with objective evidence and a rigorous understanding of your economic impact, you can secure a career path that respects your expertise and supports your long-term clinical goals.
Frequently Asked Questions
What is the average revenue generated by a gastroenterologist for a hospital?
A gastroenterologist generates an average of approximately $3.5 million in net annual hospital revenue. This figure consistently places the specialty among the top five physician revenue generators for health systems. This total includes the direct collections from your procedures and the significant downstream income from hospital-based ancillary services like imaging and laboratory work.
How does an ASC ownership stake change a gastroenterologist’s total revenue?
Ownership in an Ambulatory Surgery Center (ASC) can increase a physician's total earnings by 30% to 50% compared to hospital employment. This increase occurs because you capture a portion of the facility fees that would otherwise be retained by a hospital system. It fundamentally shifts your income profile from a reliance on professional fees to a share in the facility's operational profit.
Is wRVU still the best metric for GI physician compensation in 2026?
The wRVU model is increasingly insufficient for measuring gastroenterology physician revenue because it tracks productivity rather than actual economic value. With the 2.5% efficiency adjustment cut applied to many 2026 endoscopic work RVUs, relying solely on this metric can lead to a "productivity treadmill." Contribution margin is a more authoritative benchmark as it reflects the actual revenue remaining after variable costs.
What is the "Empwr Index" and how does it apply to gastroenterology?
The Empwr Index is a specialized tool within the Physician Economic Value Platform that translates clinical workload into a data-backed revenue profile. For gastroenterology, it accounts for specialty-specific nuances like procedural mix and site-of-service variations. It utilizes CMS and RAND data to help you lead informed conversations with administrators based on objective financial evidence.
How much revenue does an advanced endoscopist generate compared to a general GI?
Advanced endoscopists typically generate higher total revenue due to the technical complexity and higher reimbursement rates associated with procedures like ERCP and EUS. These interventional services command higher work RVUs and trigger more substantial facility fees than standard screenings. This complex work acts as a significant revenue multiplier for the health systems or practices that support these tertiary services.
Does GI revenue include pathology and anesthesia billings?
Total economic value includes the revenue generated from pathology and anesthesia, even though these services are often billed separately from your professional fee. These ancillary streams are foundational to the profitability of a GI department. Recognizing these connections is essential for accurately quantifying the full financial footprint you sustain within a hospital or large group practice.
How can I verify the RAND pricing data used in my revenue report?
You can verify RAND pricing data by accessing the RAND Corporation's public-domain hospital price transparency studies. These reports compare commercial insurer payments to Medicare rates across various geographic regions and health systems. Our platform integrates this validated data to ensure your revenue analysis is grounded in objective market realities rather than anecdotal salary surveys.
What happens if my contribution margin is lower than the national GI average?
A lower-than-average contribution margin serves as a diagnostic tool to identify operational inefficiencies in your practice. It might indicate a sub-optimal payer mix, high variable costs, or a site-of-service that doesn't maximize your procedural value. This data allows you to make informed adjustments to your professional strategy to better align your clinical effort with realized revenue.