

For decades, the healthcare industry has categorized primary care as a "loss leader," a necessary but fundamentally unprofitable gateway to more lucrative surgical specialties. You've likely felt the weight of this label during contract negotiations, where your professional worth is reduced to a wRVU total that fails to capture the true economic value of a primary care physician. It's frustrating to be viewed as a cost center when your clinical decisions are the primary driver of the organization's financial stability.
This article provides a rigorous framework to accurately quantify your financial impact in 2026. You'll learn how to move beyond opaque compensation models and use objective data to demonstrate your role as a strategic revenue engine. We'll examine the latest Medicare Physician Fee Schedule updates, including the $33.40 conversion factor, and the specific methodologies that prove primary care influences nearly 90% of all downstream healthcare costs.
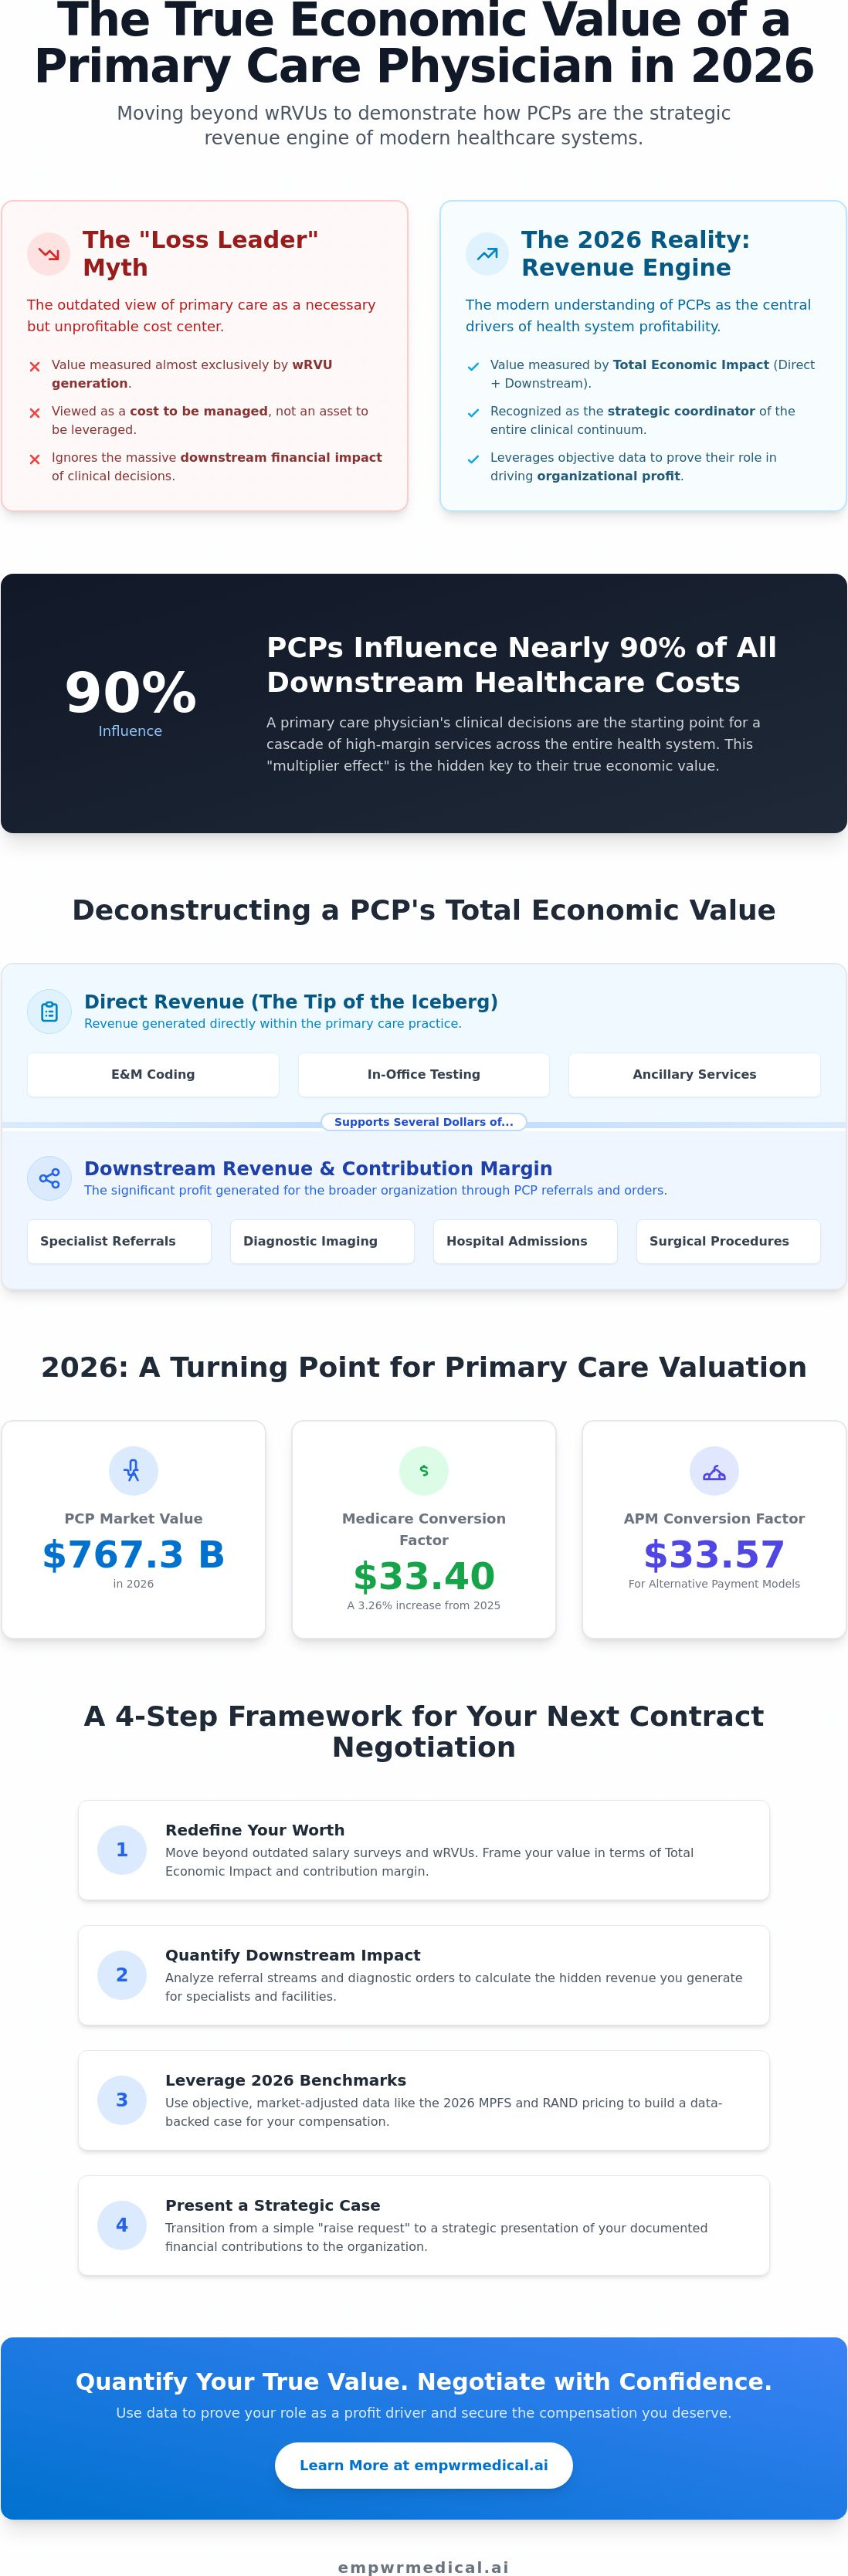
Key Takeaways
- Learn why traditional salary surveys fail to reflect the modern shift toward value-based care and how to redefine your professional worth using 2026 benchmarks.
- Identify the hidden contribution margins within your referral streams to specialists and hospital facilities that wRVU-only models frequently ignore.
- Discover how to dismantle the "loss leader" myth by analyzing the specific revenue ratios that drive health system profitability across clinical silos.
- Apply a step-by-step framework to calculate the true economic value of a primary care physician based on your direct production and downstream impact.
- Transition your next contract negotiation from a simple request for a raise into a strategic presentation of your documented financial contributions.
Defining the Economic Value of a Primary Care Physician in 2026
In 2026, the definition of professional worth for a Primary Care Physician (PCP) has moved beyond the constraints of simple volume-based productivity. While historical models relied almost exclusively on wRVU generation, the modern healthcare ecosystem recognizes a more sophisticated metric: Total Economic Value. This shift is driven by a market valued at $767.30 billion in 2026, where the economic value of a primary care physician is increasingly tied to their role as the strategic coordinator of the entire clinical continuum.
Traditional salary surveys often fail because they operate in accounting silos. They record the cost of a PCP's salary but fail to credit the physician for the millions in downstream revenue generated through diagnostic testing, specialist referrals, and facility fees. To gain a true understanding of your contribution, you must translate clinical workload into revenue estimates that account for both direct billable events and the strategic "multiplier effect" your practice creates for the broader organization.
The Components of Primary Care Valuation
A comprehensive valuation begins with direct clinical revenue, primarily derived from Evaluation and Management (E&M) coding. However, Defining Primary Care through this narrow lens ignores the ancillary revenue your decisions trigger. This includes in-office testing, imaging, and lab work that wouldn't occur without your initial assessment. In 2026, high-performing systems recognize that the economic value of a primary care physician is defined by how every dollar of direct revenue typically supports several dollars of facility-based contribution margin.
Why 2026 is a Turning Point for PCPs
The 2026 Medicare Physician Fee Schedule (MPFS) marks a significant regulatory milestone. With a finalized conversion factor of $33.40, a 3.26% increase from 2025, CMS is signaling a renewed commitment to primary care sustainability. For those in Alternative Payment Models (APMs), the factor is even higher at $33.57. These adjustments, combined with the rising importance of physician fair market value data, provide the objective evidence needed for rigorous contract negotiations.
The 2026 RAND pricing data is also influencing private payer negotiations. This transparency allows physicians to benchmark their worth against market-adjusted standards rather than opaque internal metrics. As the industry revenue for primary care doctors reaches $370.8 billion this year, the ability to quantify your individual impact is no longer optional; it's a requirement for professional and financial advocacy.
Beyond wRVUs: The Downstream Revenue and Contribution Margin of Primary Care
Traditional compensation models rely heavily on Work Relative Value Units (wRVUs) to measure productivity, but this metric is fundamentally incomplete. It tracks the volume of work performed within the four walls of an exam room while ignoring the massive financial ecosystem that work supports. To truly understand the economic value of a primary care physician, you must look at the contribution margin, which represents the revenue remaining after all variable costs are subtracted. While gross billings might look impressive on a balance sheet, they don't account for the operational expenses required to generate that income.
The discrepancy between wRVUs and actual financial impact is often stark. A PCP might generate modest direct revenue through E&M codes, yet that same physician influences nearly 90% of all downstream healthcare costs. When you integrate a contribution margin vs wRVU analysis into your professional profile, you shift the conversation from how much you "cost" the system to how much profit you "drive" for the organization.
Calculating Downstream Impact
Quantifying your referral stream requires tracking the financial trail of every order you sign. For example, a single primary care referral to a cardiologist often leads to a sequence of high-margin events, including EKGs, stress tests, and potentially cardiac catheterization. Downstream revenue is the net income generated by services ordered but not performed by the PCP. Beyond individual referrals, your role in managing "leakage" is critical. Health systems lose millions when patients seek care outside the network; therefore, your ability to maintain a tight, in-network referral loop is a high-value strategic asset. You can use a Physician Economic Value Platform to visualize these connections with clinical precision.
The Contribution Margin Framework
Moving past the loss-leader myth requires a mastery of the physician contribution margin formula. This calculation involves aggregating all revenue you generate, including direct billings and downstream facility fees, then subtracting the direct variable costs like medical supplies and clinical staff time. Unlike fixed-cost allocations, which are often arbitrary, the contribution margin provides a transparent view of your actual worth. It's the most accurate predictor of a physician's value because it isolates the revenue that would vanish if your practice were removed from the system. By documenting this margin, you provide the health system with a data-backed reason to view you as a revenue engine rather than a budgetary burden. The economic value of a primary care physician is ultimately found in this net financial contribution, making it the most powerful tool in your negotiation arsenal.
Debunking the 'Loss Leader' Myth: How PCPs Drive Health System Profitability
The "loss leader" designation is a byproduct of flawed financial architecture rather than a reflection of actual clinical performance. When health systems view primary care through siloed accounting lenses, they see a department with high overhead and lower procedural reimbursement. This narrow perspective ignores the fact that the economic value of a primary care physician is often realized in the departments they feed. By clearing patients for high-margin elective surgeries and managing chronic conditions to prevent readmission penalties, PCPs act as the essential lubricant for a profitable health system.
Traditional financial reporting often suffers from a "location bias," where revenue is credited to the site of service—such as an outpatient surgery center or an imaging suite—rather than the physician who originated the order. This structural error creates an illusion that primary care is a financial drain. In reality, high-performing systems analyze the "PCP-to-Specialist" revenue ratio, recognizing that a single primary care practice can sustain multiple specialty lines. Beyond direct referrals, your meticulous Hierarchical Condition Category (HCC) coding and risk-adjustment scores directly influence the organization's benchmark payments in value-based arrangements. This data-driven accuracy ensures the system is fairly compensated for the complexity of the patient population you manage.
Accountability vs. Siloed Profitability
Correcting the bias toward procedural revenue requires a shift in how organizations define clinical accountability. PCPs don't just generate volume; they ensure clinical safety that protects the bottom line. Care coordination led by primary care significantly reduces "never events" and the associated CMS penalties that can erode a hospital's annual margin. When you present your value, you aren't just discussing office visits; you're discussing the mitigation of financial risk across the entire enterprise. It's about translating your daily clinical vigilance into a documented reduction in institutional liability.
Primary Care as a Strategic Asset
In 2026, the strategic importance of "covered lives" has never been higher. A robust primary care base allows a health system to secure favorable contracts with private payers by demonstrating a controlled, longitudinal care model. This leverage is built on your ability to maintain patient loyalty and prevent out-of-network leakage. The economic value of a primary care physician is often hidden in the facility fees of the labs and imaging they order. By serving as the primary point of contact, you provide the health system with the scale necessary to negotiate from a position of strength rather than necessity.
Quantifying Your Individual Impact: A Framework for Primary Care Valuation
Translating clinical effort into financial clarity requires a methodical, four-step framework. This process moves the economic value of a primary care physician from a philosophical discussion to a rigorous accounting exercise. It begins with aggregating your direct wRVU production and E&M distribution to establish a baseline of billable activity. This raw data, however, represents only the "visible" portion of your economic footprint.
The second step involves estimating your downstream referral volume using national benchmarks. Since primary care influences nearly 90% of total healthcare spending, you must account for the diagnostic tests, specialty consultations, and hospital admissions you initiate. Third, apply geographic adjustments using the latest 2026 Geographic Practice Cost Index (GPCI). These indices account for regional variations in labor and practice costs, ensuring your valuation is grounded in local reality. Finally, you must calculate physician contribution margin by subtracting variable clinical costs from your total generated revenue. This provides the most transparent view of your actual worth to the organization.
Leveraging Geographic and Specialty Nuance
A PCP's value isn't static; it fluctuates based on the environment and patient complexity. In rural settings, where physician shortages are projected to reach 86,000 by 2036, a PCP’s relative value increases due to the volume of complex care managed without local specialist support. Conversely, in urban academic centers, value might be tied more closely to clinical research and high-volume throughput. You must also adjust for payer mix, as commercial reimbursement rates often differ significantly from the $33.40 Medicare conversion factor. Utilizing a specialty specific revenue analysis allows you to find your precise market position and negotiate with specialty-specific data rather than broad generalizations. This ensures the economic value of a primary care physician is captured with granular accuracy.
The Role of Authoritative Data Sources
Rigorous valuation relies on objective data rather than self-reported surveys. Traditional compensation surveys often suffer from lag times and small sample sizes, making them unreliable for 2026 negotiations. Instead, integrate the latest CMS fee schedules for precise revenue forecasting. The 2026 MPFS site-of-service differential, for instance, provides higher Practice Expense (PE) RVUs for independent offices, which can significantly impact your total valuation. Using RAND pricing data helps bridge the gap between Medicare "costs" and commercial "market value," providing a realistic benchmark for private payer negotiations. You can generate a comprehensive Empwr Index Report to synthesize these complex data points into a single, decision-ready document.
Navigating Contract Negotiations with Data-Backed Economic Clarity
Negotiation is often the most stressful phase of the physician career cycle. Historically, PCPs have entered these discussions from a defensive posture, asking for compensation increases based on subjective merit or cost-of-living adjustments. In 2026, this approach is obsolete. Success requires transitioning from "asking" to "presenting" a rigorous economic case. By articulating the economic value of a primary care physician in terms of contribution margin and downstream impact, you fundamentally change the power dynamic of the room.
The physician economic value score serves as your North Star during this process. It provides a standardized metric that translates your clinical outcomes and referral patterns into a financial language that hospital administrators and CFOs respect. The power of the Empwr Index lies in its ability to normalize your worth against 2026 benchmarks, ensuring you aren't compared to outdated 2024 data. This index acts as a bridge, moving the conversation from what you "cost" to the revenue you "secure."
Preparing for the 2026 physician contract negotiation landscape also requires understanding the macro trends currently shaping the market. With the 3.26% increase in the Medicare conversion factor and a projected physician shortage reaching 86,000 by 2036, your professional leverage has reached a historic peak. However, leverage is only effective when it's backed by objective evidence. You must be prepared to demonstrate how your practice stabilizes the health system's broader financial ecosystem.
Building Your Economic Value Proposition
Your goal is to provide a concise, one-page summary that encapsulates your total clinical and financial impact. This document should move beyond wRVUs to highlight the downstream revenue you generate for the system's surgical and diagnostic departments. When an administrator raises a "Fair Market Value" (FMV) objection, you can counter with external, location-adjusted benchmarks that prove your request is within regulatory compliance. Always focus the conversation on "Value Generated," the actual net income you bring to the organization, rather than "Time Spent."
Empowering Informed Conversations
Empwr Medical’s Physician Economic Value Platform is designed to translate clinical effort into boardroom data. It provides the transparency needed to ensure your next contract reflects your true contribution margin rather than an arbitrary salary survey average. Negotiations should be a collaborative discussion about strategic growth; they're an opportunity to align your professional goals with the system's operational realities. When you enter the room with the Empwr Index, you’re not just a clinician. You're an informed partner in the health system’s financial success. Calculate your true economic value with the Empwr Index today.
Reclaiming Your Economic Narrative in 2026
The transition from being viewed as a "loss leader" to a recognized "revenue engine" requires a shift in both data and mindset. You've seen how the economic value of a primary care physician extends far beyond direct billable units, influencing nearly 90% of downstream healthcare costs through strategic referrals and medical optimization. By moving past the wRVU metric and mastering your contribution margin, you position yourself as an indispensable asset to any health system's financial stability.
Success in your next negotiation depends on having the right evidence at your fingertips. Our platform is physician-founded and specifically designed for clinical workflows, utilizing authoritative CMS and RAND data sources to ensure location-adjusted and specialty-specific accuracy. It's time to replace opaque institutional benchmarks with clear, actionable insights that reflect your true worth. Quantify your clinical impact with a personalized Empwr Index Report. You've already done the hard work of providing exceptional care; now, let the data speak for your value.
Frequently Asked Questions
What is the average downstream revenue generated by a primary care physician in 2026?
While individual figures depend on patient volume and specialty mix, primary care physicians influence nearly 90% of all downstream healthcare costs. In a market where industry revenue for primary care is expected to reach $370.8 billion in 2026, a single physician often directs millions in facility fees and specialty revenue. This reflects the economic value of a primary care physician as the primary coordinator of high-margin diagnostic and surgical services.
How do I calculate my contribution margin as a PCP?
You calculate your contribution margin by taking the total revenue you generate, including both direct billings and downstream facility fees, and subtracting your direct variable costs. These costs typically include clinical staff time, medical supplies, and office expenses specifically tied to patient encounters. Unlike traditional productivity reports, this calculation isolates the actual profit your presence adds to the health system's bottom line by ignoring fixed institutional overhead.
Why is my wRVU production not reflecting my total economic value?
The wRVU metric is designed to measure individual labor volume rather than total financial impact. It tracks the time and intensity of the services you personally perform but ignores the economic value of a primary care physician as an originator of orders. When you refer a patient for a $5,000 imaging study or a $30,000 surgery, the wRVU model credits the performing specialist while ignoring your role as the revenue driver.
Can I use CMS and RAND data to negotiate my physician contract?
Yes, utilizing objective benchmarks from the 2026 Medicare Physician Fee Schedule and RAND pricing data is essential for a data-driven negotiation. CMS data establishes a clear reimbursement floor with the $33.40 conversion factor, while RAND reports bridge the gap by showing how commercial rates compare to Medicare. These sources provide the transparency needed to challenge opaque internal salary surveys and justify a compensation model based on market reality.
What is the 'Empwr Index' and how does it help physicians?
The Empwr Index is a proprietary scoring system that synthesizes your direct production, downstream revenue impact, and regional cost data into a single metric. It helps physicians by translating complex clinical effort into a standardized "value score" that administrators and CFOs can easily understand. This index provides the clarity required for informed conversations during contract renewals, ensuring your compensation reflects your true contribution to the health system.
Is primary care really a 'loss leader' for hospitals?
The "loss leader" label is an accounting fallacy caused by siloed financial reporting. Hospitals often credit revenue to the location where a service is performed, such as an imaging center, rather than the physician who ordered it. When you account for the downstream revenue and the prevention of readmission penalties, primary care is actually a strategic revenue engine that supports the entire organization's profitability.
How do geographic adjustments affect my economic valuation?
Geographic adjustments, specifically the 2026 Geographic Practice Cost Index (GPCI), account for regional variations in labor, rent, and malpractice insurance. Your economic valuation is higher in areas where these costs are elevated or where physician shortages are most acute. For example, a PCP in a rural area with a projected shortage may have a higher relative value because they manage complex cases that would otherwise require expensive out-of-network referrals.
What is the difference between direct revenue and downstream clinical value?
Direct revenue is the income generated specifically from the services you bill, such as office visits and in-office procedures. Downstream clinical value represents the net income from every service you trigger but don't perform yourself, including labs, imaging, and specialist consultations. Understanding this difference is key to reclaiming your professional identity as a driver of institutional growth rather than a simple provider of E&M services.