

The 90th percentile benchmark is often presented as an absolute ceiling, but in reality, it is a historical snapshot that fails to account for your current economic value. You likely feel the frustration of a clinical workload that does not correlate with your take-home pay, especially when hospital financial reporting remains opaque. Understanding physician compensation survey limitations is the first step toward reclaiming your leverage. These surveys often rely on data that is twelve to twenty-four months old; this lag is particularly problematic given the 2.5% reduction in work RVUs introduced in the 2026 Medicare Physician Fee Schedule.
You've worked hard to reach your professional standing, and you deserve a compensation model that reflects the revenue you generate today, not what your peers earned years ago. This article will help you identify the specific structural flaws in hospital-provided data and provide a framework for calculating your true economic contribution. By shifting from arbitrary benchmarks to objective financial modeling, you can move away from feeling "capped" and begin negotiating from a position of data-backed authority. We will explore how to translate complex backend metrics into a clear professional strategy that secures your actual market worth.
Key Takeaways
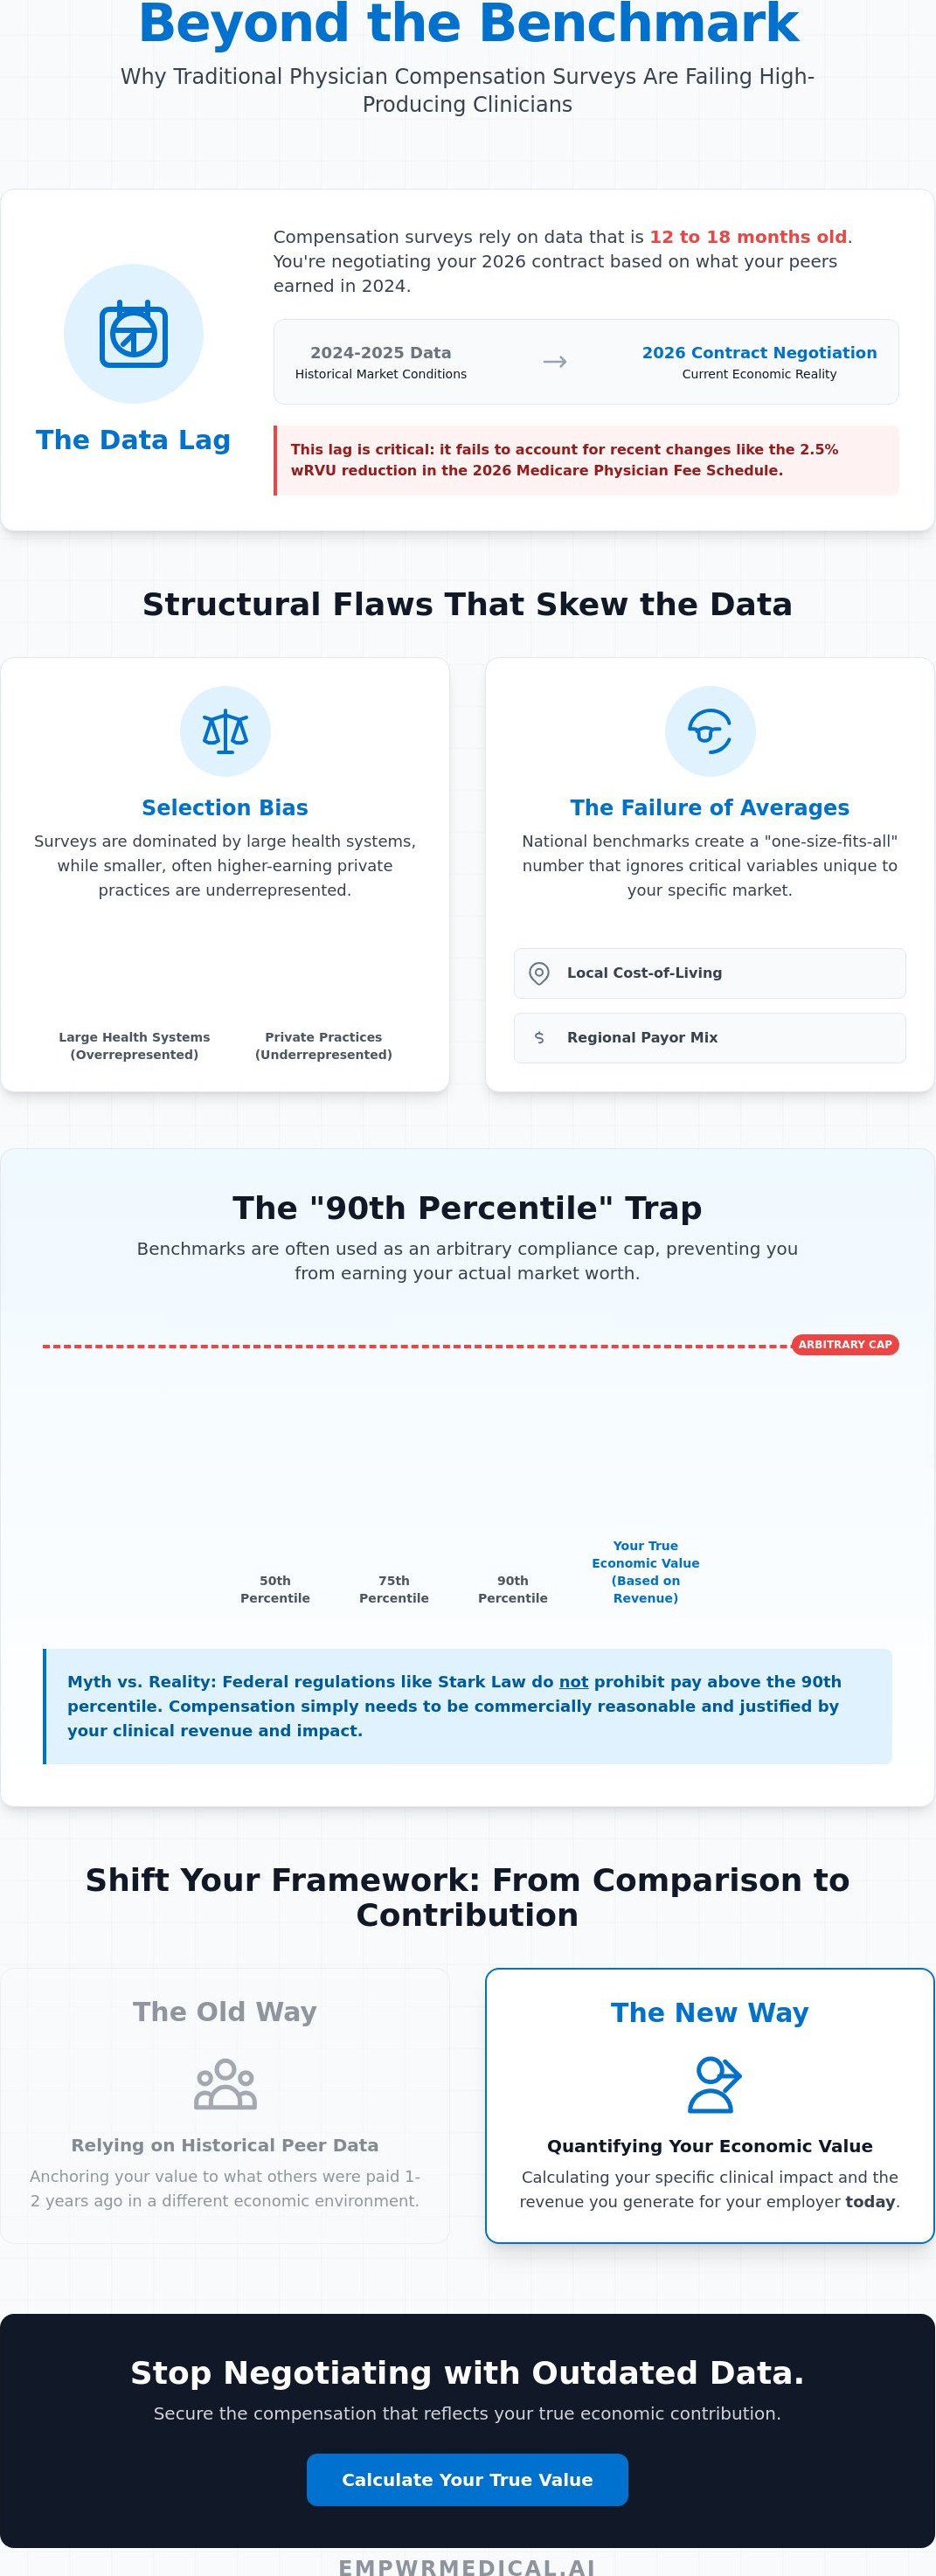
- Recognize that traditional surveys provide retrospective snapshots that often lag behind current market conditions by 12 to 18 months.
- Identify how structural physician compensation survey limitations, such as selection bias and health system overrepresentation, can skew the data used to determine your Fair Market Value.
- Analyze why national averages fail to account for critical local variables like cost-of-living adjustments and regional payor mix nuances.
- Examine the tactical use of the 90th percentile as an arbitrary compliance cap and learn how to challenge these limits with objective financial evidence.
- Discover how to transition from comparing historical peer data to quantifying your specific clinical impact through specialty-specific revenue analysis.
The Myth of the 'Gold Standard': Why Compensation Surveys Are Only the Starting Point
For years, health system administrators have positioned data from organizations such as MGMA and SullivanCotter as the absolute "gold standard" for determining salaries. These reports are essentially retrospective data collections; they record what physicians were paid in the previous calendar year rather than what they are worth today. While these benchmarks offer a broad industry perspective, they are purely historical and fail to account for real-time shifts in clinical demand. Relying on these snapshots is a primary example of physician compensation survey limitations that high-producing clinicians encounter during contract discussions.
Hospitals utilize these benchmarks to establish Fair Market Value (FMV), often to satisfy regulatory compliance. While the National Compensation Survey (NCS) provides a foundational methodology for labor data collection, it lacks the specialty-specific granularity required to value complex medical workflows. In a high-production clinical environment, "average pay" is a poor proxy for economic value. There is a distinct difference between market-based valuation, which looks at what your peers earned in the past, and revenue-based valuation, which focuses on the specific contribution margin you generate for your employer now.
The Role of Benchmarks in 2026 Contract Negotiations
In 2026, many health systems use the 50th and 75th percentiles as psychological anchors to keep discussions within a narrow financial band. This approach often reframes the negotiation around a generic median rather than your individual clinical impact. Administrators frequently treat these surveys as "hard limits" even though they were designed as guidance. Securing a contract that reflects your true worth requires looking at physician fair market value data through a lens that integrates current productivity and the 2026 Medicare wRVU adjustments. Surveys alone cannot account for these rapid regulatory shifts.
Myth vs. Reality: Are Surveys Legally Binding?
A common misconception is that the Stark Law mandates a specific percentile cap on physician pay. It doesn't. Federal regulations require that compensation is commercially reasonable and does not exceed FMV, but they don't prohibit paying above the 90th percentile if your clinical revenue justifies it. If your procedural volume and downstream impact are high, your "Reasonable Compensation" can legally sit well above national medians. Fair Market Value is a flexible range determined by specific economic circumstances, not a fixed point on a survey spreadsheet.
Structural Blind Spots: Data Lag, Selection Bias, and Reporting Errors
The structural integrity of any benchmark depends entirely on the freshness and accuracy of its inputs. One of the most significant physician compensation survey limitations is the pervasive 12 to 18 month reporting lag. When you review a 2026 compensation report, you are actually viewing a snapshot of 2024 and 2025 market conditions. This delay is particularly hazardous in the current economic environment, where the 2026 Medicare Physician Fee Schedule has already introduced a 2.5% reduction in work RVUs for most non-time-based services. Relying on historical data means you are negotiating based on a reimbursement landscape that no longer exists.
Selection bias further distorts these datasets. Large health systems are significantly overrepresented because they possess the administrative staff required to complete lengthy, voluntary surveys. Smaller, high-efficiency private practices often lack the bandwidth to participate, which effectively erases their higher-earning models from the national median. This bias creates an artificial "gravity" that pulls reported averages toward institutional norms rather than true market potential. Evaluating these variables through an Empwr Index Report helps bridge the gap between historical surveys and today's operational realities.
Reporting errors at the administrative level add another layer of opacity. Administrators often fail to distinguish between clinical wRVUs and administrative credits when submitting data. There is also a lack of standardization regarding benefits; some reports include 401k matches and CME stipends in "total compensation," while others list only base pay and productivity bonuses. This inconsistency makes it nearly impossible to compare two "median" figures with any degree of precision.
The Hidden Impact of Reporting Lag
While annual surveys wait for data to be scrubbed and published, CMS data for physician compensation updates with much greater frequency. Using 2024 data to negotiate a contract that will run through 2028 is a strategic risk. It ignores the 3% rise in compensation observed throughout 2025 and misses the inflationary pressures currently driving up the cost of practice operations. Retrospective surveys are inherently unable to capture these rapid shifts in real-time.
Specialty Misclassification and 'Niche' Erasure
Broad categorization is a major failure of traditional benchmarks. Sub-specialists, such as those in Interventional Cardiology or Electrophysiology, are often lumped into a general "Cardiology" bucket. This erasure ignores the specific complexity of care and the higher revenue potential associated with advanced procedures. A specialty specific revenue analysis provides the granular view necessary to distinguish your unique contribution from the generic average of a broader field. Without this level of detail, you are effectively being penalized for your specialization.
The Failure of Averages: Why National Benchmarks Ignore Local Realities
National averages are a statistical convenience for hospitals, but they often act as an economic anchor for the individual physician. One of the most glaring physician compensation survey limitations is the failure to account for local cost-of-living (COL) adjustments. A physician practicing in a high-COL metropolitan area like San Francisco or New York is effectively penalized when their pay is benchmarked against a national median that includes data from rural, low-cost regions. This flattening of data allows health systems to keep local wages stagnant, even as local operational costs and personal expenses continue to rise.
Payor mix variations represent another critical oversight in aggregate data. National benchmarks are often heavily weighted by CMS reimbursement rates, yet local markets vary wildly in their commercial insurance landscape. If your specific practice environment is dominated by private payors that reimburse at significantly higher rates, a national "average" doesn't reflect the actual revenue you generate. Hospitals often use these broad figures to decouple your pay from the specific economic value created by your local patient population, ignoring the reality that your contribution margin is higher than the national norm.
Leveraging RAND Pricing Data for Local Precision
To counter the "black box" methodology of traditional surveys, you must look toward more transparent sources. Understanding how to use RAND pricing data for physician valuations and negotiations offers a way to see real-world commercial multiples in your specific region. While surveys provide a murky aggregate, RAND data provides clarity on how local commercial insurers compare to federal rates. Commercial insurance often pays 200-300% of Medicare, a financial reality that generic surveys rarely highlight when presenting a simple salary figure.
Accounting for Regional Workforce Shortages
Supply and demand are local phenomena that annual aggregate surveys fail to capture with any precision. In regions facing acute specialty shortages, the "market rate" is dictated by the immediate need for care, not a 12-month-old national spreadsheet. You can use "Community Need" as a powerful justification for exceeding survey benchmarks during contract discussions. If a health system cannot staff a critical service line without your expertise, the economic value of your presence far outweighs a generic percentile. Geographic-specific economic modeling allows you to move beyond the urban discount or rural premium paradox and secure a contract based on the actual scarcity of your skillset.
The '90th Percentile' Trap: How Benchmarks Are Used to Cap Physician Earnings
The 90th percentile is frequently treated as an immutable legal barrier, yet this perception is one of the most damaging physician compensation survey limitations. Administrators often cite "compliance reviews" as a reason to halt salary increases, claiming that exceeding this threshold risks violating Fair Market Value (FMV) standards. This creates a "Hard Cap" strategy where legal departments refuse to authorize payments beyond a specific survey coordinate, regardless of the physician's actual revenue generation. For high-productivity clinicians, this results in an artificial ceiling that decouples effort from reward.
In many health systems, this leads to the "working for free" phenomenon. This is exacerbated by the 2026 Medicare Physician Fee Schedule, which introduced a 2.5% reduction in work RVUs for most non-time-based services. Because it now requires more clinical effort to reach the same wRVU targets, an arbitrary cap at the 90th percentile becomes even more restrictive. Once a physician hits the wRVU threshold associated with this benchmark, their incentive conversion factors may drop significantly. Even though the clinical work continues, the financial return for that incremental effort is effectively eliminated, forcing the most efficient members of the medical staff to subsidize institutional overhead.
Deconstructing the Compliance Objection
When an employer states that "the survey won't let us pay you more," they are often conflating institutional risk tolerance with actual regulatory mandates. To bypass these arbitrary caps, you must shift the conversation toward your contribution margin. If you can demonstrate that your clinical activity generates revenue far exceeding your total compensation, you prove that your pay is commercially reasonable. Utilizing a framework for quantifying physician value allows you to present objective economic data that satisfies compliance officers while securing your market worth. You can gain the data-backed authority needed for these discussions through the Physician Economic Value Platform.
When Productivity Outpaces the Benchmark
High-volume surgeons and proceduralists are most at risk from survey limitations. Traditional models often suffer from "wRVU compression," where the value of each additional unit of work decreases as you become more efficient. Instead of accepting a flat cap, you should negotiate for "Tiered" conversion factors. These models reward efficiency by maintaining or even increasing the dollar-per-wRVU rate once you surpass the 75th percentile. This ensures that your compensation continues to scale alongside your clinical impact rather than hitting a plateau dictated by outdated historical averages.
Beyond Benchmarks: Quantifying Your True Economic Value
The transition from peer-based benchmarking to performance-based economic modeling is a necessary evolution for high-level professionals. While traditional surveys focus on the question "what are others paid?", a more relevant inquiry for your career strategy is "how much revenue do I generate for this institution?" Recognizing physician compensation survey limitations is the catalyst for this shift. By utilizing a physician economic value score, you can transform a subjective negotiation into a transparent financial analysis based on objective reality.
The foundation of this approach is the calculation of your contribution margin. The formula is precise: Clinical Revenue minus Direct and Indirect Costs equals your actual economic value. Unlike static surveys that aggregate disparate data points, this calculation accounts for your specific procedural efficiency and the actual reimbursement rates of your local payors. The Empwr Index Report provides the clarity needed to visualize your standing in the market, acting as a bridge between your clinical output and your professional strategy. It allows you to move past the distraction of national medians and toward a valuation that respects your individual productivity.
Building a Data-Driven Negotiation Deck
To negotiate from a position of authority, you must arrive with granular evidence. This process begins with gathering your own CPT code frequency and payor mix data. By applying the physician relative value units explained framework to your specific volume, you can quantify the exact revenue impact of your clinical hours. Presenting "Economic Contribution" as your primary metric for contract renewal changes the dynamic of the conversation. It forces administrators to move away from citing generic benchmarks and toward acknowledging the specific financial reality of your service line.
The Future of Physician Valuation
Static annual surveys are rapidly being replaced by real-time data platforms that reflect current market dynamics and specialty-specific nuances. Bringing superior, location-adjusted data to the table provides a significant psychological advantage during contract discussions. It demonstrates a level of professional rigor and strategic insight that is difficult to dismiss with vague compliance objections or "soft cap" strategies. The future of physician valuation is rooted in transparency, accuracy, and objective evidence. Calculate your true economic value with Empwr Medical to ensure your compensation reflects the actual revenue you bring to your organization.
Reclaiming Your Market Worth Through Economic Clarity
Traditional benchmarks are often used as a shield by administrators, but they aren't the definitive measure of your professional value. By recognizing the inherent physician compensation survey limitations, you can shift the conversation from historical averages to your current economic contribution. You've seen how reporting lags and regional blind spots distort Fair Market Value, and how the 90th percentile trap is used to artificially cap your earnings. True leverage comes from bringing objective, real-time data to the negotiation table.
As a physician-founded and led advocacy partner, we provide the specialty-specific revenue modeling you need to quantify your clinical impact. Our methodology utilizes current CMS fee schedules and RAND pricing data to ensure your valuation is grounded in operational reality rather than generic medians. This level of precision transforms a standard contract review into an informed strategic discussion. It's time to move beyond the constraints of retrospective data and advocate for a contract that reflects your actual contribution margin.
Empower your next negotiation with the Empwr Index.
Frequently Asked Questions
Why do hospitals rely so heavily on MGMA and other surveys?
Hospitals utilize these surveys primarily as a defensive mechanism to ensure compliance with federal Stark Law and Anti-Kickback Statute regulations. By anchoring physician pay to established benchmarks, administrators create a standardized paper trail that supports "Fair Market Value" during federal audits. This reliance simplifies complex financial decision-making by providing a consistent reference point, even if those benchmarks don't fully reflect an individual's specific economic contribution.
Can I be paid above the 90th percentile of a compensation survey?
You can legally be compensated above the 90th percentile if your clinical productivity and revenue generation justify the amount as commercially reasonable. While many health systems present the 90th percentile as an absolute "hard cap," federal law does not mandate a specific percentile limit. If your procedural volume or specialty-specific revenue contribution is exceptional, your compensation can exceed national medians while remaining fully compliant with Fair Market Value standards.
How much of a time lag is there in typical physician salary data?
Typical physician salary data carries a reporting lag of 12 to 18 months between the initial data collection and the final publication. For instance, a survey released in 2026 likely reflects clinical activities and economic conditions from 2024 and 2025. This delay is a significant factor in physician compensation survey limitations, as it fails to capture recent regulatory shifts like the 2.5% reduction in work RVUs introduced in the 2026 Medicare Physician Fee Schedule.
What is the difference between 'market value' and 'economic value'?
Market value is a peer-based metric that measures what other physicians in similar roles are being paid, whereas economic value is a performance-based metric measuring the revenue you actually generate. Market value relies on historical snapshots and national averages that often ignore local realities. Economic value focuses on your specific contribution margin, calculating your clinical revenue minus direct and indirect costs to determine your true worth to the institution.
Do compensation surveys include bonuses and call pay?
Most major surveys attempt to report "total cash compensation," which generally includes base pay, productivity bonuses, and call pay, but reporting accuracy varies between institutions. Administrators may inconsistently categorize these components when submitting data, leading to a "black box" effect. It is often unclear whether reported figures include non-cash benefits like 401k matches or CME stipends, which makes precise comparisons between different survey medians difficult and often misleading.
How do I challenge a 'survey-based' salary offer during a contract renewal?
Challenge a survey-based offer by shifting the conversation toward your individual contribution margin and current economic data. Instead of debating percentiles, present a data-driven deck that highlights your CPT code frequency, payor mix, and the downstream revenue you generate. Highlighting physician compensation survey limitations, such as the inherent data lag and lack of local cost-of-living adjustments, helps dismantle the administrator's reliance on generic national medians during the negotiation.
What data sources are more accurate than traditional surveys for 2026?
Real-time platforms that integrate current CMS fee schedules and RAND pricing data offer significantly higher accuracy than static annual surveys. These sources provide transparent, location-adjusted insights into commercial insurance multiples, which often pay 200-300% of Medicare rates. Moving away from voluntary, self-reported benchmarks toward objective financial modeling allows for a more precise valuation of your clinical impact based on the actual reimbursement environment of 2026.
Is it legal to use hospital-specific revenue data in my negotiation?
It is entirely legal and strategically necessary to use your own clinical productivity and revenue data during contract negotiations. While you should respect institutional policies regarding proprietary financial reports, you have a professional right to understand the economic output associated with your personal NPI number. Quantifying the revenue you bring to the system is a standard method for establishing commercial reasonableness and ensuring your compensation reflects your true economic value.