

What if your hospital administration viewed your compensation not as an overhead expense to be trimmed, but as a strategic investment with a measurable return? Most physicians feel like a cost center in an era where median hospital operating margins are hovering around -0.6%. You've likely seen your pay stagnate despite rising clinical complexity and a 2.5% reduction in wRVU values for many services in 2026. It's a common struggle, especially when you lack access to the backend financial data required for justifying physician salary to hospital administration.
You don't have to accept a narrative that ignores your actual economic impact. We'll show you how to translate your clinical workload into a compelling business case that administrators cannot ignore. This guide provides a framework for moving beyond standard benchmarks to focus on your specific contribution margin and total revenue generation. You'll learn how to build a data-backed ROI report that gives you the confidence to lead your next negotiation from a position of objective strength.
Key Takeaways
- Move beyond wRVU metrics to understand why clinical effort does not always correlate with the financial outcomes administrators prioritize.
- Master the contribution margin formula to quantify your specific impact on the hospital's bottom line and operational health.
- Identify the limitations of voluntary survey data and learn to use CMS fee schedules for more objective benchmarking when justifying physician salary to hospital administration.
- Establish a methodical approach for gathering CPT frequency and wRVU totals to build a credible, 12-month trailing business case.
- Leverage the Physician Economic Value Platform to simplify complex data analysis and generate a clear, professional negotiation strategy based on the Empwr Index.
The RVU Trap: Why Traditional Metrics Fail to Justify Physician Salaries
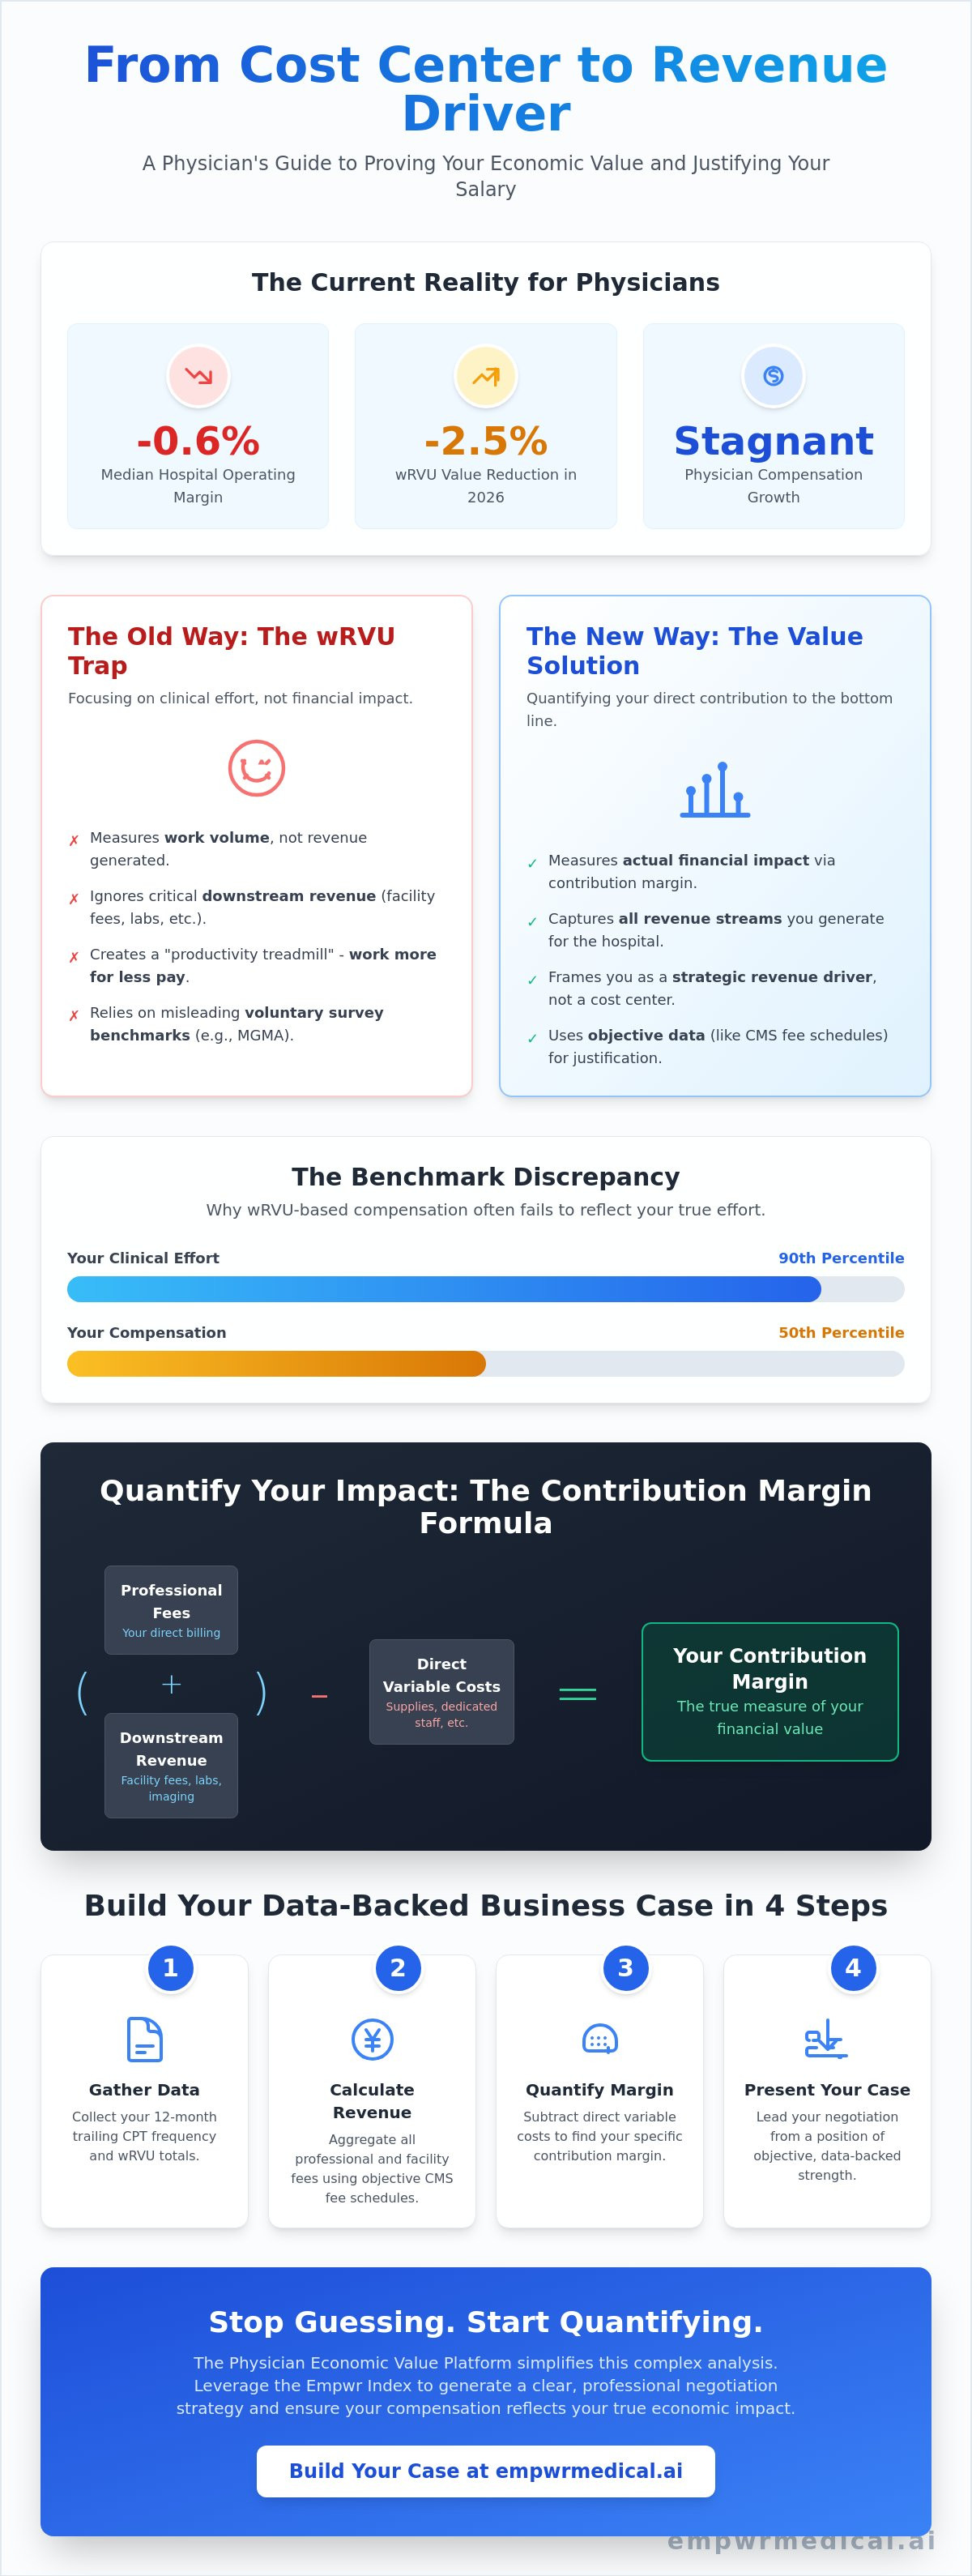
The standard compensation model in most health systems relies heavily on Relative Value Units (RVUs) to measure performance. While these units provide a standardized way to quantify clinical effort, they're fundamentally disconnected from the hospital's financial reality. Administrators often use these metrics as the sole basis for salary discussions, yet wRVUs only measure the volume of work performed, not the revenue that work generates. This creates a significant hurdle when you're justifying physician salary to hospital administration, as your clinical intensity may not translate into the financial language your CEO understands.
Many clinicians find themselves on a productivity treadmill. You work harder and see more patients, but your compensation remains flat or even declines in real terms. This is particularly evident in 2026, as CMS introduced a 2.5% reduction in wRVU values for most non-time-based services. If your contract is tied strictly to wRVU benchmarks, you're essentially working more for less. True economic value sits at the intersection of your clinical expertise and the actual financial margin your services provide to the institution.
The Limitations of wRVU Benchmarking
Relying on external benchmarks like MGMA can be misleading. It's common for a physician to exert 90th percentile effort while receiving only 50th percentile compensation. This discrepancy often stems from fixed conversion factors and regional reimbursement variations that wRVUs simply cannot account for. Additionally, traditional metrics ignore the downstream value you create. A surgeon’s value isn't just the procedure itself; it's the facility fees, anesthesia revenue, and post-operative ancillary services that follow. Without capturing these data points, your professional contribution is chronically undervalued.
Reframing the Physician as a Revenue Center
To change the outcome of a negotiation, you must shift the narrative from cost per physician to revenue per clinical hour. Administrators often view salaries as a liability because they lack a clear view of the provider-level contribution margin. By quantifying physician value through direct revenue analysis, you move from being a cost center to a strategic revenue driver. In an environment where administrative bloat is increasing and hospital margins are thin, providing objective data is the only way to ensure your compensation reflects your actual economic impact. This clarity is essential for any professional justifying physician salary to hospital administration in a competitive market.
Quantifying Your Impact: How to Calculate Physician Contribution Margin
While wRVUs measure the volume of your work, the contribution margin measures the financial health of that work. In an environment where the median health system operating margin was -0.6% in early 2026, administrators are laser-focused on fiscal sustainability. To succeed in justifying physician salary to hospital administration, you must shift the conversation toward the actual profit you generate after direct expenses are paid. This requires a granular understanding of how your clinical activity translates into net collections for the facility.
The contribution margin is defined as your total gross revenue minus direct variable costs. For most physicians, gross revenue is a combination of professional fees and the technical or facility fees generated by their orders. While you might only see your professional billing, the hospital captures significant revenue from the imaging, lab work, and operating room time you initiate. Calculating your impact involves aggregating these streams to show the full economic picture of your practice.
The Contribution Margin Formula for Clinicians
To determine your net revenue, you must identify the collections associated with your NPI number across all payers. You then subtract the variable costs that wouldn't exist if you weren't practicing at the facility. These include:
- Direct clinical supplies and specialized equipment costs.
- Dedicated support staff, such as your specific medical assistants or scribes.
- Variable clinical overhead directly tied to your patient volume.
Contribution margin is the true measure of a physician’s fiscal sustainability within a complex hospital system.
Capturing Downstream and Indirect Value
Your value often extends far beyond your direct encounters. This "multiplier effect" is critical for primary care providers who support multiple specialists or for surgeons who drive high-margin ancillary services. You should also quantify "keepage," which is the revenue retained when you refer patients within your health system rather than allowing referral leakage to competitors. Using a specialty specific revenue analysis can help you uncover these hidden profit centers that traditional benchmarks overlook.
By presenting these figures, you demonstrate that your salary isn't just a line-item expense but a driver of institutional growth. Generating this level of transparency often requires a specialized Physician Economic Value Platform to bridge the gap between clinical logs and hospital billing systems. This data-driven approach ensures that the process of justifying physician salary to hospital administration is rooted in objective financial reality rather than subjective effort metrics.
Beyond MGMA: Using Authoritative Data for Objective Benchmarking
Administrators often rely on MGMA or SullivanCotter as the definitive sources for Fair Market Value (FMV). While these surveys are common, they're fundamentally limited by their voluntary nature and inherent reporting lag. When justifying physician salary to hospital administration, relying solely on these benchmarks can leave you at a disadvantage, as they frequently underrepresent the real-time economic value of high-performing clinicians. To build a truly compelling case, you must look beyond static surveys and leverage more dynamic, objective data streams.
A data-driven negotiation requires a multi-faceted approach. You need to account for the actual reimbursement environment, including the 2026 Medicare Physician Fee Schedule, which finalized a 3.26% increase in rates for all physicians. Relying on survey data that might be 12 to 18 months old fails to capture these regulatory shifts or the fact that physicians in Advanced Alternative Payment Models (APMs) received a 3.77% increase this year. Using real-time valuation tools allows you to present a defense that is grounded in current market realities rather than historical averages.
The Flaws in Traditional Compensation Surveys
The primary issue with voluntary surveys is self-selection bias. Organizations that report data often have different overhead structures or payer mixes than your specific facility. Survey lag time is also a critical factor; for instance, while median physician compensation rose by roughly 3% in 2025, inflation ended that year at 2.7%. If your benchmarking data doesn't reflect these inflationary pressures or the rising cost of clinical practice, your salary requests will appear disconnected from the economy. This is why physician fair market value data requires verification from multiple objective sources to remain credible during administrative scrutiny.
Utilizing CMS and RAND Data Streams
Rather than starting with what others are paid, start with what your services are worth to the system. You can translate your CPT codes directly into revenue estimates by applying current CMS conversion factors and adjusting for your specific geographic location. To address commercial insurance, look to the RAND Hospital Price Transparency studies. These reports provide insight into the multiples of Medicare that private payers are actually paying in your region. By combining CMS base rates with RAND commercial multipliers, you create a transparent, bottom-up valuation of your practice. This methodology provides a much more robust foundation for justifying physician salary to hospital administration than a simple percentile ranking from a voluntary survey.
Building Your Business Case: A Step-by-Step Guide for Hospital Administration
Moving from abstract data to a formal proposal requires a methodical translation of your clinical effort into institutional profit. Hospital administrators process information through the lens of risk and return; therefore, your presentation must speak that language. Success in justifying physician salary to hospital administration depends on your ability to present a cohesive Economic Value Report that contrasts your generated margin against your current total compensation. This isn't about asking for more; it's about aligning your pay with the actual revenue you bring to the health system.
The core of your business case should be built on 12 months of trailing clinical data. By aggregating your CPT frequency and total wRVUs, you can estimate gross charges and net collections with high precision. This bottom-up approach allows you to preempt the "Fair Market Value" objection. If you can prove that your requested salary remains well within a sustainable percentage of your net contribution, you remove the administrator's primary reason to say no. You can use the the physicians guide to data driven contract negotiation in 2026 framework to structure your preparation phase.
Step 1: Audit Your Clinical Output
If the hospital administration is reluctant to provide your billing data, you can often extract these details from your EHR or personal billing logs. Focus on categorizing your procedures by revenue potential. High-complexity cases often carry higher technical fees for the hospital, which are frequently omitted from physician-facing reports. Identifying these high-margin encounters is essential for justifying physician salary to hospital administration, as it highlights your role as a primary revenue driver rather than a cost center.
Step 2: The ROI Presentation
Your presentation should visualize the gap between your current salary and the total economic value you generate. Include your direct net collections, downstream revenue from referrals, and non-clinical contributions like quality metric achievements or leadership roles. Frame the request as a "market correction" rather than a raise. This terminology suggests that the current contract is an outlier that needs to be brought back into alignment with the 2026 economic reality. To streamline this process, you can generate a professional Empwr Index Report that automates these complex calculations into a decision-ready format.
When you enter the meeting, structure the conversation around value first. Lead with the impact you've had on patient outcomes and service line growth. Follow this with the objective financial data you've gathered. Finally, end with a specific, data-backed ask. This sequence ensures that by the time you discuss numbers, the administrator has already accepted the premise of your immense value to the institution.
Leveraging the Empwr Index for Data-Backed Salary Negotiations
The process of justifying physician salary to hospital administration shouldn't rely on manual spreadsheets or anecdotal evidence of workload. While previous sections outlined the mathematical foundations of contribution margin, the practical application in a boardroom requires a higher level of synthesis. Administrators value "decision-ready" data; they need information that's already been vetted, benchmarked, and formatted for immediate executive review. This is where the Physician Economic Value Platform transforms your raw clinical data into a sophisticated business case.
By automating the complex interplay between CPT frequency, payer mix, and direct variable costs, you remove the risk of human error and administrative pushback. Objective data acts as a neutral arbiter in these conversations. When you present a report that aligns with established financial standards, you aren't just asking for a raise; you're providing the administration with the documentation they need to ensure compliance with Stark Law and Anti-Kickback statutes. Fair Market Value (FMV) is a legal requirement, and having a rigorous, data-backed defense protects both you and the institution.
The Empwr Index: Your Financial North Star
The Empwr Index provides a single, authoritative score that reflects your total economic impact on the health system. It's a multidimensional metric that incorporates CMS conversion factors, RAND commercial pricing data, and specialty-specific nuances that generic surveys often miss. A physician economic value score is fundamentally more persuasive than a resume or a list of clinical achievements. It allows you to compare your performance against regional and national benchmarks instantly, providing the context necessary to show why your current compensation may be an outlier. This clarity shifts the power dynamic, moving the conversation from a subjective evaluation of your "worth" to an objective analysis of your economic output.
Securing Your Professional Future
Utilizing a continuous data access model prevents the gradual salary erosion that often occurs between contract cycles. Instead of an annual cycle of "begging" for adjustments, you can maintain a strategic financial partnership with your administration. You'll have the transparency needed to track how shifts in clinical complexity or 2026 regulatory changes affect your bottom-line contribution in real time. This proactive stance ensures that your compensation remains aligned with the revenue you generate, regardless of broader institutional pressures. By utilizing these decision-ready reports, justifying physician salary to hospital administration becomes a collaborative exercise in long-term financial planning rather than a confrontational negotiation. Calculate your true economic value with Empwr Medical today.
Take Command of Your Professional Value
The transition from clinical volume to economic value is essential in a landscape defined by thin hospital margins and evolving reimbursement models. By moving beyond the limitations of wRVU benchmarks and quantifying your specific contribution margin, you transform yourself from a line-item expense into a strategic revenue driver. You now have the framework to present a business case that's rooted in the objective reality of your practice's fiscal impact.
Empwr Medical provides the tools necessary for justifying physician salary to hospital administration with absolute precision. Our physician-founded platform utilizes specialty-specific revenue modeling and authoritative data from CMS and RAND to ensure your valuation is both accurate and compliant. You don't have to navigate these complex financial conversations without evidence. Get your Empwr Index Report and start your negotiation with confidence.
Clarity is your greatest asset at the bargaining table. We're here to help you reveal the hidden truths of your professional contribution and secure the compensation you've earned.
Frequently Asked Questions
How do I justify a higher salary if the hospital says I am already at the MGMA ceiling?
You justify a higher salary by demonstrating that your specific economic contribution exceeds the averages captured in voluntary surveys. MGMA data is often lagged and fails to account for high-complexity cases or regional payer mix advantages. By presenting your actual contribution margin, you prove that a higher salary is fiscally sustainable for the hospital, regardless of where it falls on a static percentile chart.
What is the most important financial metric for a physician to know before a negotiation?
The physician contribution margin is the most critical metric to master before entering a negotiation. This figure represents the total revenue you generate minus the direct variable costs associated with your practice. Unlike wRVUs, which only measure effort, the contribution margin tells the administrator exactly how much profit your presence adds to the hospital's bottom line and overall operational health.
Can I use technical fees and facility fees to justify my professional salary?
Yes, technical and facility fees are essential components of your total economic impact. While your professional fee covers your clinical time, the hospital captures significant revenue from the imaging, labs, and operating room resources you utilize. Including these in your business case is a key strategy for justifying physician salary to hospital administration, as it reveals the full scope of your revenue-generating power.
How do I respond when administration says my department is "losing money"?
You should request a provider-level profit and loss statement to separate your individual performance from departmental overhead. Departments often appear to lose money due to high fixed costs or administrative bloat that you don't control. By focusing on your specific contribution margin, you can show that you're a net revenue driver even if the broader department faces financial challenges or unsustainable institutional pressures.
Is it legal to ask for a salary that exceeds Fair Market Value (FMV) benchmarks?
It's legal to seek compensation that reflects your specific economic value, provided it's supported by objective data. Fair Market Value is a range determined by multiple factors, not just a single survey percentile. If your productivity, specialty-specific nuances, and generated revenue are exceptionally high, a salary that exceeds standard benchmarks can still be considered compliant with Stark Law and Anti-Kickback statutes.
What data sources should I use besides MGMA for physician salary benchmarking?
You should leverage the 2026 Medicare Physician Fee Schedule and RAND Hospital Price Transparency studies for more accurate valuation. CMS data provides real-time updates on conversion factors, such as the 3.26% increase for 2026. RAND data helps you understand the multiples of Medicare that commercial payers are actually paying in your specific geographic region, offering a more granular view than voluntary surveys.
How often should a physician renegotiate their compensation based on economic data?
A physician should review their compensation data annually and consider formal renegotiation every two to three years. However, significant regulatory shifts, such as the 2026 wRVU value reductions for certain specialties, may require an earlier conversation. Maintaining continuous access to your economic data ensures you can address salary erosion as soon as it occurs rather than waiting for a contract expiration.
What is the difference between a wRVU and a contribution margin in salary discussions?
The primary difference is that wRVUs measure clinical effort while the contribution margin measures financial profit. A wRVU is a unit of work defined by CMS that doesn't account for reimbursement rates or facility fees. In contrast, the contribution margin accounts for actual collections and expenses, making it the superior metric for justifying physician salary to hospital administration during strategic negotiations.